Restarting the server temporarily helps, but then in a couple/few minutes the performance take a massive hit and stays that way.
I’ve tried disabling the stats.pl collection via webmin stats collection (was 5 minutes, which I presume was the default since we never changed it) and there was no improvement so we set it back.
If I restart MySQL/Mariadb the performance will again improve but a couple minutes later will drop again.
I’ve been trying to resolve this for a few days and have not had any success. I am hoping someone here can offer a solution.
I’ve seen it asked in other threads so I will mention that there are Wordpress websites running on this Virtualmin server among other virtual servers such as Nextcloud (only 1 user, mostly used as a in-house dropbox file share), and a couple Lychee photo instances.
If I have left anything out that can help, just let me know.
You’ll need to figure out which app and which queries are chewing up Mariadb. Then you can fix the query or tune the database for that specific work.
Turning on slow query logging is often a good first step. Figuring out which site is hitting the database so hard is another (many ways to do this, look for the most php-fpm processes queued up and waiting, check the logs, check your analytics if any, maybe you just know which of your sites has high activity).
You need to know what the specific problem is before you can solve it. So, don’t start trying to tune until you have a baseline understanding of what problem you’re trying to solve, you can’t fix what you don’t understand. Once you know what’s going wrong, then you can try to make it go right. Maybe it’s a really dumb query in one of your WordPress plugins, maybe you can add an index to resolve it quickly, maybe you can update or replace that plugin with a more efficient one. Maybe it’s a DDoS and implementing ModSecurity or sticking a CDN with DoS protection in front will help. Maybe it’s something else. You have plenty of memory free so it’s not swap thrashing.
The default Mariadb configuration is pretty optimal for a lot of workloads. I generally wouldn’t start tuning until I know what I’m trying to solve.
One exception: OP has a lot of memory, so it’d be reasonable to bump up some of the common caches a bit. But, also, caching and memory management in Linux is extremely effective and Mariadb is built to work fine with OS caching, so it’s rare that increasing cache sizes makes a huge difference. OP has a huge problem, so minor tweaks to Mariadb configuration aren’t going to solve it.
It’s probably a poorly written WordPress plugin that needs queries cleaned up or an index added.
Where can I check what is currently set and increase the cache size(s)? Also is this a global setting, or must this be done on a per virtual server basis?
I mentioned that the nightly backups do not complete. I found a email with a message with some details:
Copying MariaDB user details ..
   .. backup of mysql failed : mysql::execute_sql failed : DBI connect failed :  Can't connect to local MySQL server through socket '/run/mysqld/mysqld.sock' (2)
Can I disable virtual servers one by one and re-enable them without causing any harm to the websites or associated databases?
The Webmin Mariadb module has a Server Configuration page, which offers some of the options for cache sizes (for the full set, you have to look at the config file, probably /etc/my.cnf or /etc/mariadb.conf or some or the extra config files in /etc/mysql or /etc/mariadb). But, again, you’re not going to tune your way out of this problem. It’ll make a tiny difference. It’s not harmful or risky to double or whatever, the default query cache size, on a system as large as yours, but it’s also not a silver bullet.
You really need to figure out what’s slamming the database and fix it.
It is a global setting. MariaDB doesn’t know what a Virtual Server is.
Yes. Though I’d probably disable just the website, instead. On Debian you can quickly do that with a2dissite and re-enable with a2ensite, without impacting mail and other services. Note it’s also possible a cronjob or some other kind of scheduled job is what’s slamming the database, in which case, disabling the site won’t stop it (nor will disabling the Virtual Server…nobody will be able to login, but Virtualmin doesn’t delete user cron jobs and the like).
And, your backups aren’t completing because Mariadb isn’t responding in time…so, fix Mariadb, you fix the backups for free.
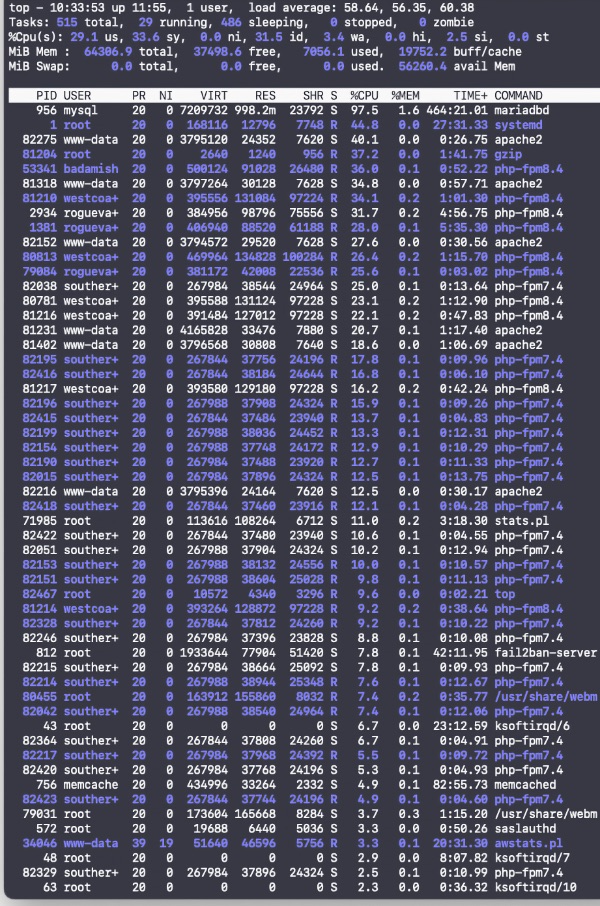
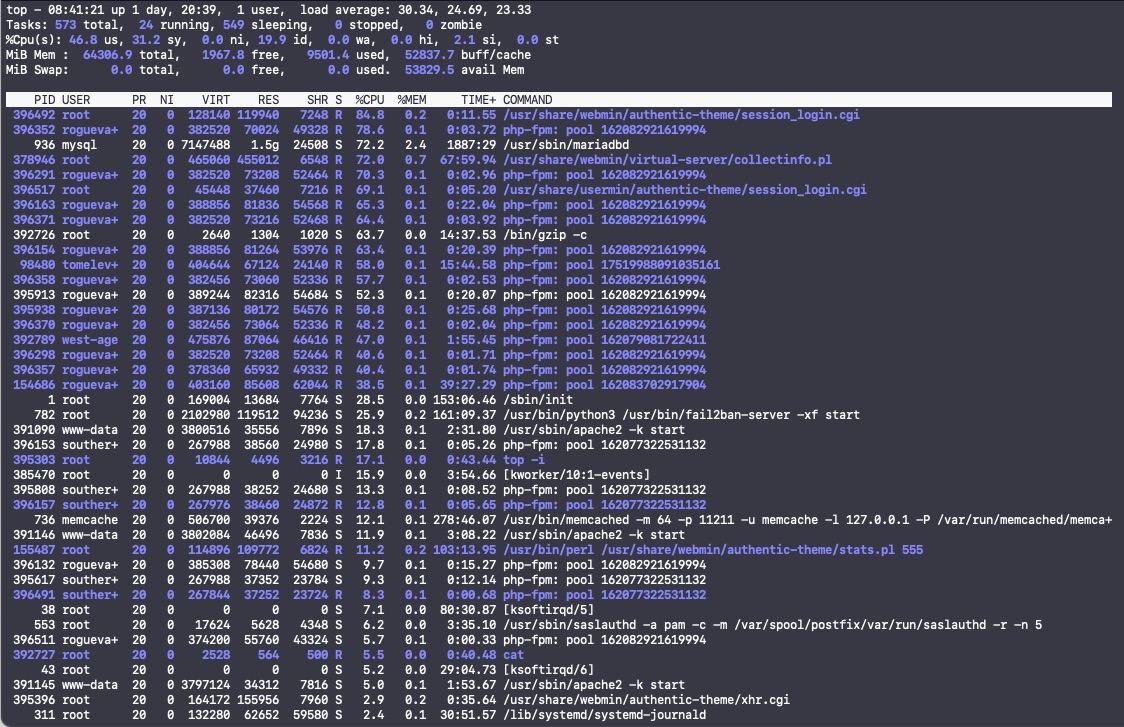
Still trying to figure this out. Not sure where to see which virtual machine is causing all the high mariadb usage. It looks like “webm” (is that webmin?) frequently hits over 100% CPU.
I also notices that I am getting this email frequently and I don’t know if it this service is crashing due to the high CPU usage:
Monitor on [server.roguevalleydigital.com](http://silicon.roguevalleydigital.com/) for 'Postfix Server' has detected that the service has gone down at 08/04/2026 11:40 PM
The reason I am having difficulty identifying which virtual machine is causing the high CPU load is there are around 10 domain names like roguevalleydigital.com, roguevalleysupport.com, etc. that all contain roguevalley and top truncates making them appear as rogueval+.
I tried installing htop but is is painfully slow and I have to wait a minute or two for it to start each time and it truncates the USER anyway.
Is there a suggestion where, a log perhaps, that I should be looking at to help identify which virtual machine is causing all the mariadb/CPU usage?
You can use c to switch to showing the full process path in top, as long as you have a nice wide terminal to show it in.
And, I doubt webm is Webmin? Webmin shows up as perl and miniserv.pl in my usual top output, I think, as those are the actual executables being run…but, maybe something is different in how process names show up on your system. c should answer that.
It looks like the webmin login script and usermin login scripts are using a lot of CPU. The thing is I am the only user on this Virtualmin instance and am already logged in. I also nearly never use the usermin login and certainly was not using it when this screenshot was taken.
gzip -c can certainly use cause load level to increase which could ‘back up’ everything else. I just had a drive in a mirrored raid fail and the io or the resync spiked the load average even though nothing else ‘abnormal’ seemed to be happening. (Should have replace both as now I just had to order the second anyhow )
Thank you for this reply, but I do not understand it. I do not recall ever setting up any gzip -c, or any gzip anywhere. Is it possible this is a Wordpress required PHP module? There are around 10 or more Wordpress websites running on this server. All have pretty much the same configurations and plugins.
The point is IO can create high load levels. Failing disks can create hi IO too. The auth cpu could be created because it has to wait. Kind of a cascading thing. I believe you said the load level goes down if you turn of Mariadb? I’d still be looking there. So many moving pieces and we only see a slice based on what YOU think is relevant. Auth processing should create negligible over head. Once you auth, the process dies.
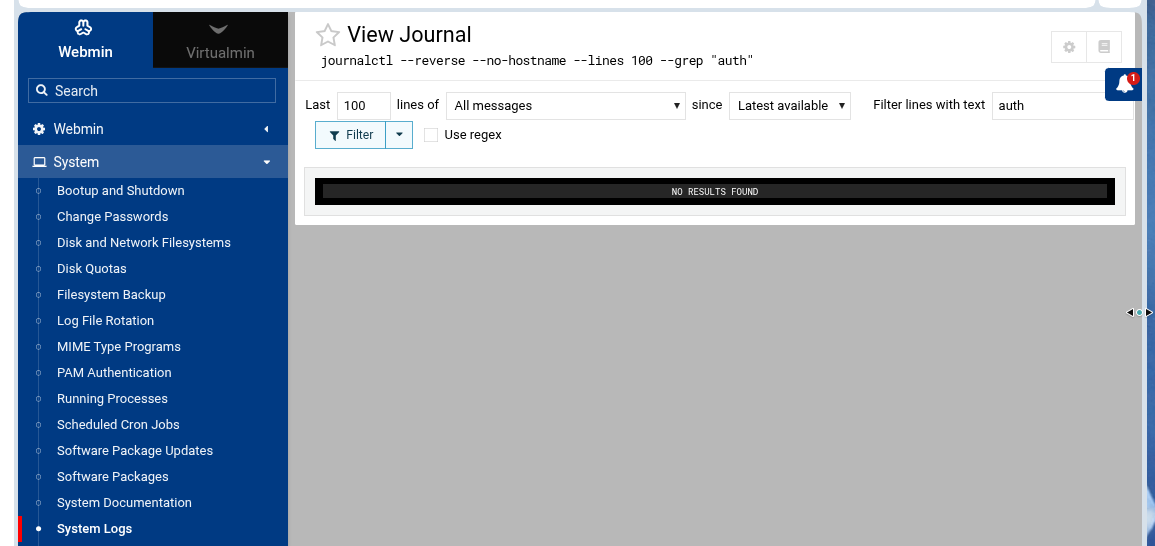
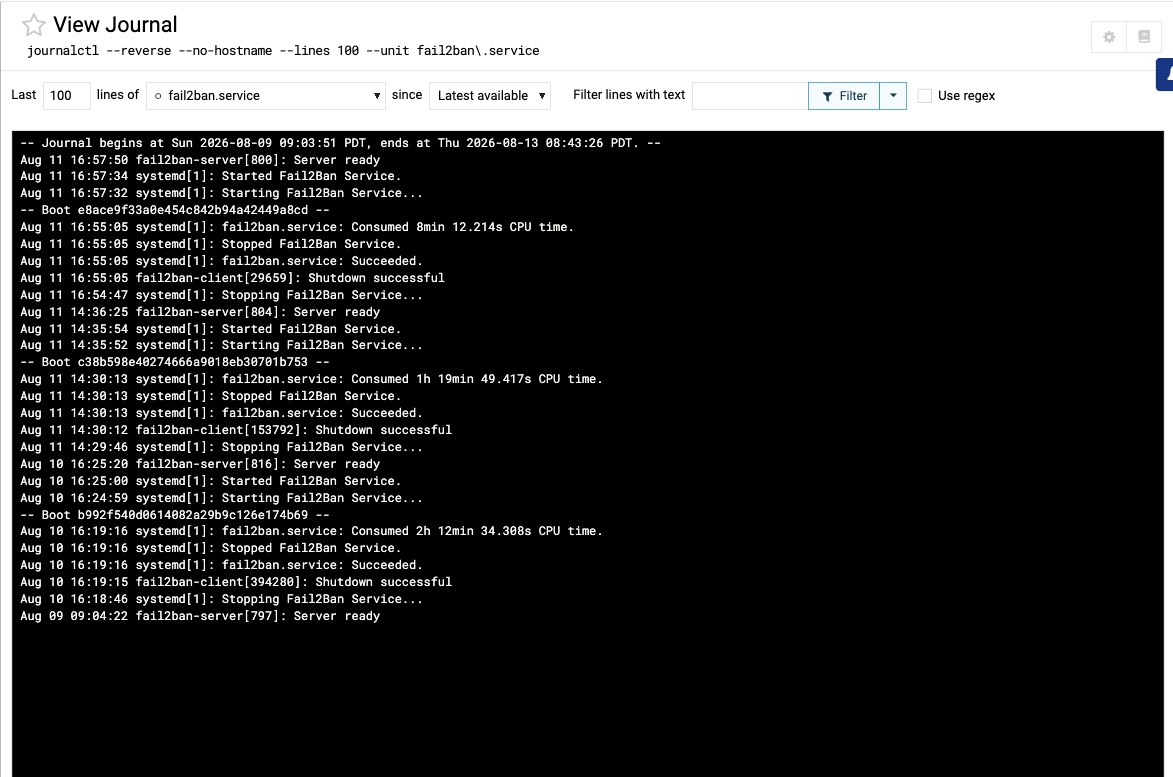
Start looking at the logs. Notice the filter field.
That means the login page is being hammered by bots for some reason. fail2ban should theoretically be adding firewall rules to block IPs with repeated failed logins, so that should be contained, but since it’s not, it seems like fail2ban must not be working for some reason. So I’d check the fail2ban logs, and make sure the rules are coming into existence. If you see fail2ban log entries like “already banned” or something, that means it’s creating rules that aren’t working (a misconfiguration of fail2ban or the firewall it’s trying to manage isn’t actually running/working). Debian has had some firewall-related complexity of late because they introduced conflicts in their cloud-init package that made firewalld uninstallable. So, if you don’t have firewalld and if fail2ban is configured to use firewalld instead of iptables or nftables, then that would be an explanation.
The low-hanging fruit for Usermin is to simply stop the service. If you don’t use it, it shouldn’t be running. That’s true of all services. A service that isn’t running cannot be abused.
For Webmin, a quick test could be to move it to another port. The bots might find it again eventually, but if this is some kind of DDoS attempt or whatever, then moving to another port will cause it to drop off for some time (maybe forever, depending on how persistent the attackers are and whether they’re attacking you specifically or just any old Webmin they find).
There is improvement. Here is what I’ve done up to today:
Removed a plugin from several Wordpress websites called “WPForms Lite”. This is a form plugin that was used as a contact us to send the website owner a email contact. One website that I had used “a2dissite” to deactivate for a couple days spawned around 12 PHP-FPM users instantly upon re-enabling and slowed the server to a crawl. Deactivating the the WPForms Lite plugin improved the server performance. I had reported that the postfix service had begun sending me service down emails which was why I tried disabling this particular plugin.
The daily backup email had stopped coming for a few weeks but I would receive an occasional failed email which was MySQL related.
We had a sub-domain setup with “Matomo” that was collecting website statistics for all the Wordpress websites - around 10-12 - and I removed that sub-domain and the associated Wordpress plugin from all the websites. This seemed to also help improve the performance of the server. Going forward I will just use the Awstats.
Yesterday’s backup email:
Backup is complete. Final size was 11.79 GiB. Total backup time was 12 hours, 02:48 minutes.
Todays Backup Email:
Backup is complete. Final size was 11.59 GiB. Total backup time was 6 hours, 22:51 minutes.
This is still 3 times slower that it used to be (was around 2 hours per night).
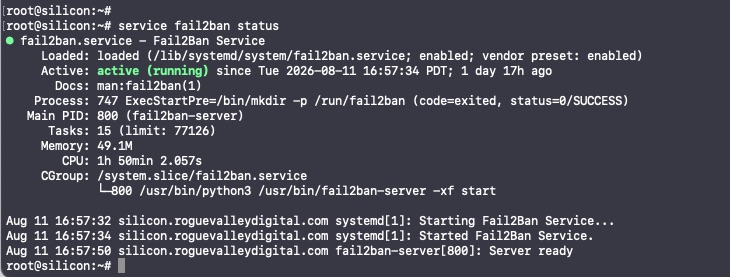
That isn’t your fail2ban ‘log’. It is showing the service, not what it is doing. It does seem to be working quite hard though. Notice how much cpu time you are using. This mine for 2 months worth.
root@main:/var/log# service fail2ban status
● fail2ban.service - Fail2Ban Service
     Loaded: loaded (/lib/systemd/system/fail2ban.service; enabled; vendor preset: enabled)
     Active: active (running) since Sat 2026-05-30 23:28:02 EDT; 2 months 13 days ago
       Docs: man:fail2ban(1)
   Main PID: 761 (fail2ban-server)
      Tasks: 29 (limit: 19031)
     Memory: 41.2M
        CPU: 1d 5h 16min 22.550s
     CGroup: /system.slice/fail2ban.service
             └─761 /usr/bin/python3 /usr/bin/fail2ban-server -xf start
I’m still on the old log file system so I can’t give you the journalctl command but this is what mine looks like for the fail2ban log.
root@main:/var/log# tail -20 fail2ban.log
2026-08-13 09:39:11,493 fail2ban.filter         [761]: INFO    [postfix-sasl] Found 152.52.194.154 - 2026-08-13 09:39:11
2026-08-13 09:41:21,042 fail2ban.filter         [761]: INFO    [dovecot] Found 186.69.245.83 - 2026-08-13 09:41:20
2026-08-13 09:41:24,787 fail2ban.filter         [761]: INFO    [dovecot] Found 186.69.245.83 - 2026-08-13 09:41:24
2026-08-13 10:11:24,546 fail2ban.filter         [761]: INFO    [dovecot] Found 186.69.245.83 - 2026-08-13 10:11:24
2026-08-13 10:11:27,789 fail2ban.filter         [761]: INFO    [dovecot] Found 186.69.245.83 - 2026-08-13 10:11:27
2026-08-13 10:55:10,295 fail2ban.filter         [761]: INFO    [dovecot] Found 89.186.12.17 - 2026-08-13 10:55:09
2026-08-13 10:55:19,288 fail2ban.filter         [761]: INFO    [dovecot] Found 89.186.12.17 - 2026-08-13 10:55:18
2026-08-13 10:55:28,036 fail2ban.filter         [761]: INFO    [dovecot] Found 89.186.12.17 - 2026-08-13 10:55:27
2026-08-13 10:55:32,456 fail2ban.filter         [761]: INFO    [dovecot] Found 89.186.12.17 - 2026-08-13 10:55:32
2026-08-13 10:55:34,995 fail2ban.filter         [761]: INFO    [dovecot] Found 187.120.73.111 - 2026-08-13 10:55:34
2026-08-13 10:55:43,786 fail2ban.filter         [761]: INFO    [dovecot] Found 187.120.73.111 - 2026-08-13 10:55:43
2026-08-13 10:55:52,287 fail2ban.filter         [761]: INFO    [dovecot] Found 187.120.73.111 - 2026-08-13 10:55:51
2026-08-13 10:55:58,038 fail2ban.filter         [761]: INFO    [dovecot] Found 187.120.73.111 - 2026-08-13 10:55:57
2026-08-13 10:56:51,544 fail2ban.filter         [761]: INFO    [postfix-sasl] Found 112.199.192.139 - 2026-08-13 10:56:51
2026-08-13 11:32:03,051 fail2ban.filter         [761]: INFO    [postfix-sasl] Found 189.56.0.19 - 2026-08-13 11:32:02
2026-08-13 11:32:18,491 fail2ban.filter         [761]: INFO    [postfix-sasl] Found 182.95.181.50 - 2026-08-13 11:32:18
2026-08-13 11:32:37,243 fail2ban.filter         [761]: INFO    [postfix-sasl] Found 157.211.246.182 - 2026-08-13 11:32:36
2026-08-13 12:10:20,799 fail2ban.filter         [761]: INFO    [postfix-sasl] Found 46.10.210.68 - 2026-08-13 12:10:20
2026-08-13 12:11:13,243 fail2ban.filter         [761]: INFO    [postfix-sasl] Found 211.105.229.237 - 2026-08-13 12:11:13
2026-08-13 12:11:28,790 fail2ban.filter         [761]: INFO    [postfix-sasl] Found 50.231.243.28 - 2026-08-13 12:11:28
 )
)