I resumed testing the latest development version today, and overall, things have improved significantly compared to before.
Previously, the UI was so sluggish that it was nearly unusable — especially when opening the main (left-side) menu. It would open with a noticeable delay, and expanding the submenus took even longer.
Now, the experience is much smoother. I believe some of my initial confusion was caused by the 5-second delay you mentioned, which makes sense in the context of WebSocket activity.
Overall, the changes you’ve implemented are excellent. I can now work comfortably, even with real-time monitoring enabled.
One interesting observation: performance appears noticeably better in Firefox compared to Chromium-based browsers. Do you have any idea why that might be?
If you’d like, I can privately share a screen recording or provide DevTools output from the “Performance” and “Network” tabs on a mobile device.
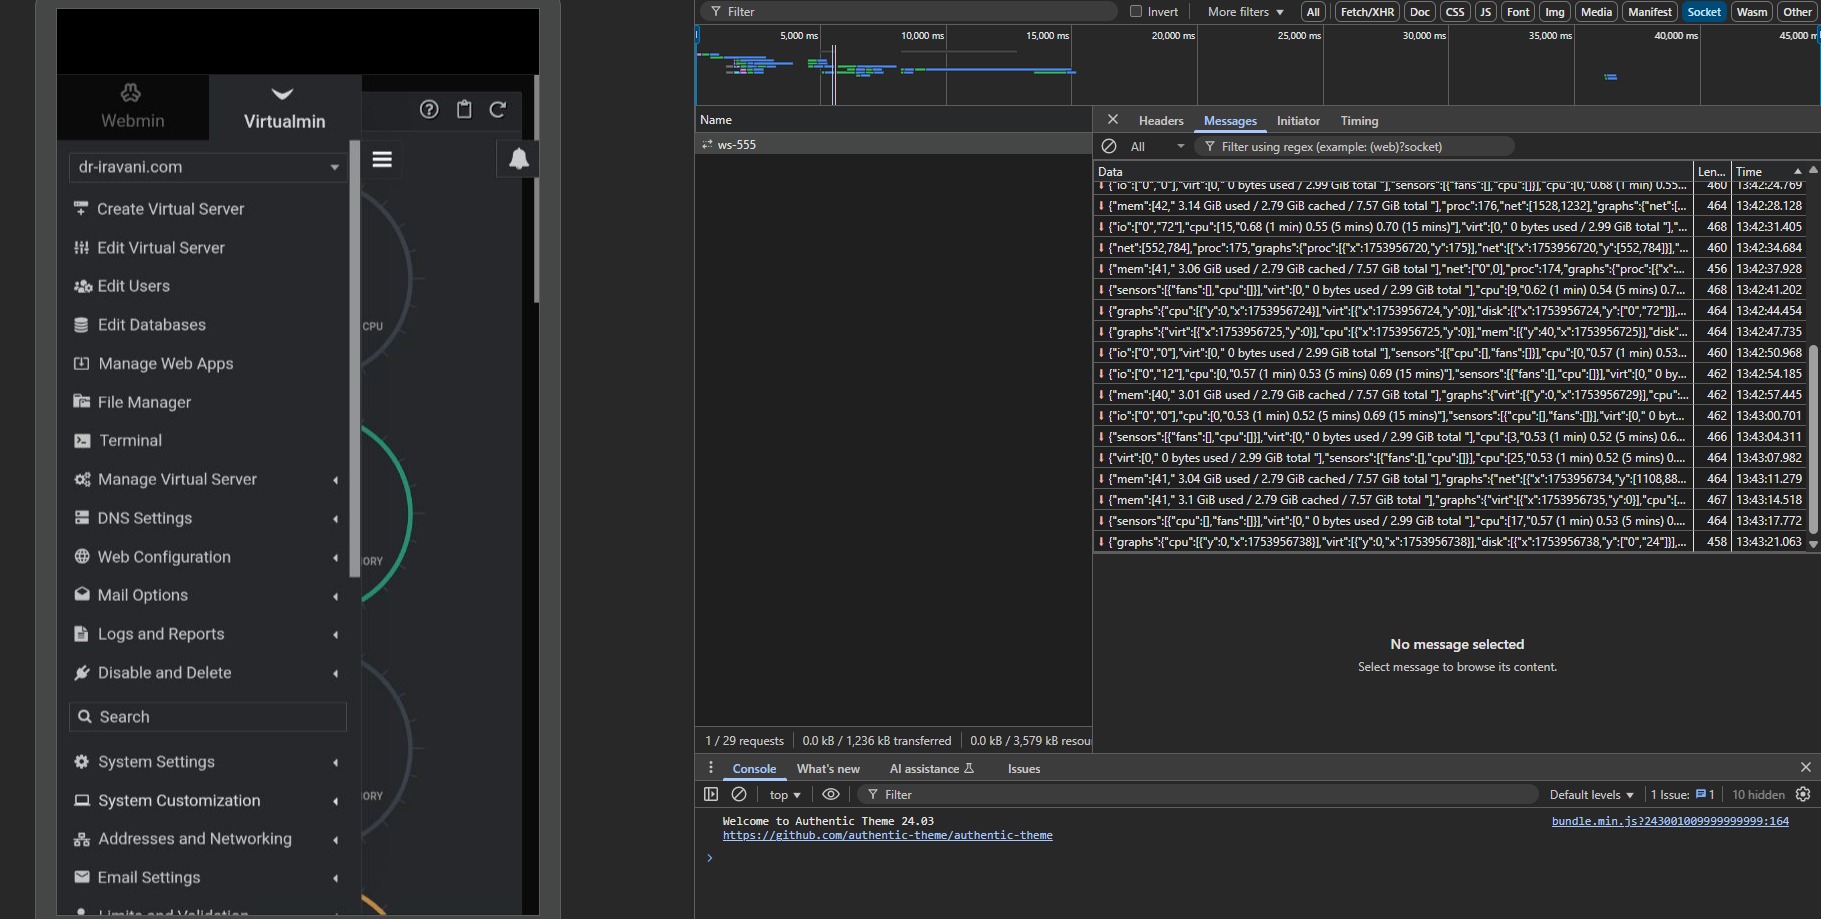
By default, users are redirected to the System Information page, where WebSocket activity (ws-555) is active. Based on my observations using DevTools, there is sometimes a delay when attempting to open the main menu on mobile devices — even while the menu is open, part of the System Information page remains active in the background, and the WebSocket connection continues.
If it’s possible to temporarily pause WebSocket activity related to the System Information page while the main menu is open (on small screens or mobile devices), I believe the overall responsiveness of the user interface could be improved even further. After all, when a user opens the menu, they are usually not focused on real-time updates at that moment
Yes, I’ve tested that scenario — even when the System Information page remains open in the background (e.g. while the main menu is expanded), the WebSocket connection stays active and real-time communication doesn’t pause..
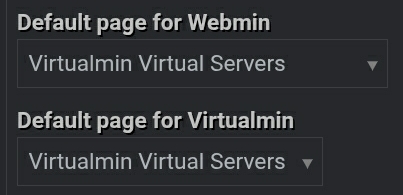
For example, after changing the default landing page (under theme settings) from the dashboard to another section, the interface behaves just as smoothly as when real-time monitoring is disabled.
This strongly suggests that WebSocket activity on the System Information page impacts overall UI responsiveness — especially on mobile devices, which typically have less processing power than desktop computers.
Of course, you know this far better than I do — but I just wanted to mention something I noticed:
It doesn’t seem like the WebSocket itself causes the slowdown, since it’s meant for real-time communication.
However, I wonder if the way the dashboard reacts to incoming data (like frequent UI updates for metrics and graphs) might be contributing to increased load — especially on mobile.
Just a thought — perhaps something to consider for future refinements, if you see it relevant.
I took a look into the minified code of bundle.min.js so I can’t see what it all does exactly (I think it’s for the live stats on the homepage), but there are maybe some problems/possible optimizations in there.
        function r(e) {
        var i = t.normalizeData(this.data, e.reverseData, true);
            this.svg = t.createSvg(this.container, e.width, e.height, e.classNames.chart);
            var n = this.svg.elem("g").addClass(e.classNames.gridGroup);
            var r = this.svg.elem("g");
.... etc.
It’s called dozens of times per second and in this function there are several forEach in forEach loops that combined to almost a 1000 iterations each time on it’s on. So up to 100.000 iterations per second for this function alone.
Probably it’s all needed, I don’t know, but it seems heavy code to me. Loops in loops (in loops) is one thing that always scares me in js code . Maybe some optimization is possible.
Indeed I see, when not on the homepage with the live stats, the menu is responding as fast as ever.
Update: I’ve read the function, it’s indeed the drawing of the Stats History I see. And it’s drawing all the lines, points and paths, and those are a lot. And this is affecting the performance. Switch to Canvas could fix it maybe.
On the other side, it is only affecting the homepage and the stats are cool.
There is a quick and easy fix maybe? As far as I can see, the script is still running when the ‘Stats History’ panel is toggled/hidden. So it is still painting in the browser in the background. Toggle the script on and off when toggle the panel could work.
@Stegan for the time being you could remove the ‘Stats History’ panel from the dashboard for now, should speed things up in windy Scottish iles.
I just wanted to take a moment to sincerely appreciate the incredible work the Virtualmin development team has done over the years.
As someone who’s been working with servers and control panels for quite a while, I can say with confidence that Virtualmin has grown into a truly solid and powerful product — one that in many ways stands shoulder-to-shoulder with commercial alternatives, and in some cases even surpasses them.
It’s easy to focus on what could be better (and constructive feedback is definitely important), but I believe it’s equally important to acknowledge the long-standing dedication, hard work, and open-source spirit that make Virtualmin what it is today.
No software is ever perfect, but what this team has achieved — especially in a space dominated by big-budget, paid panels — is remarkable.
Big respect and thanks to Ilia, Jamie, Joe, and everyone else behind the scenes. Your work matters, and it’s deeply appreciated.