Troubleshooting Websites Timing Out

SYSTEM INFORMATION
OS type and version Rocky Linux 9.3
Webmin version 2.105

I’ve had a Webmin server running for over a year now. It is up to date, as far as I can tell, but it is starting to timeout on all of my websites and has gotten worse over the past couple of days. I’ve tried looking at the logs through the Webmin interface, but not seeing anything that is really sticking out.

From my last restart of the entire server, the sites lasted about 10 minutes before they were timing out again. I’m not afraid to dig into the terminal, but I’m confused as to where I should start troubleshooting.

Webmin seems to work fine, but it starts to lag and PuTTY has periods where it lags as well, much more than normal.

Any thoughts would be appreciated. Thank you!

It sounds like a CPU usage problem? Your dashboard graphs this. May be some runaway or uncontrolled process.

top from the command line would be useful for this too.

1 Like

Whats are you pings like, if you set the ping with a longer count then the default (/n) and are you seeing timeouts.
If so then use tracert if the issue is between you and the server.

Also what to of website, are the all types, like plain static html or wordpress type sites.

Steve

Here’s a baseline since I just rebooted again. I’ll check on it in a couple hours when I’m back and see where we are at.


[rootbeer@server ~]# top
top - 19:47:39 up 8 min,  1 user,  load average: 0.42, 0.47, 0.25
Tasks: 243 total,   1 running, 242 sleeping,   0 stopped,   0 zombie
%Cpu(s):  0.2 us,  0.3 sy,  0.0 ni, 99.3 id,  0.0 wa,  0.1 hi,  0.1 si,  0.0 st
MiB Mem :  15707.9 total,  11898.4 free,   3053.5 used,   1281.1 buff/cache
MiB Swap:   8052.0 total,   8052.0 free,      0.0 used.  12654.4 avail Mem

    PID USER      PR  NI    VIRT    RES    SHR S  %CPU  %MEM     TIME+ COMMAND
   1315 redis     20   0  108024  56464   7820 S   0.7   0.4   0:01.57 redis-server
    248 root      20   0       0      0      0 I   0.3   0.0   0:02.32 kworker/2:2-events
    879 root      20   0 2783256  58136  36904 S   0.3   0.4   0:02.98 fail2ban-server
   4844 root      20   0    8188   4084   3224 R   0.3   0.0   0:00.18 top
      1 root      20   0  169704  13548   9856 S   0.0   0.1   0:03.61 systemd
      2 root      20   0       0      0      0 S   0.0   0.0   0:00.01 kthreadd
      3 root       0 -20       0      0      0 I   0.0   0.0   0:00.00 rcu_gp
      4 root       0 -20       0      0      0 I   0.0   0.0   0:00.00 rcu_par_gp
      5 root       0 -20       0      0      0 I   0.0   0.0   0:00.00 slub_flushwq
      6 root       0 -20       0      0      0 I   0.0   0.0   0:00.00 netns
      8 root       0 -20       0      0      0 I   0.0   0.0   0:00.00 kworker/0:0H-events_highpri
     10 root       0 -20       0      0      0 I   0.0   0.0   0:00.00 mm_percpu_wq
     11 root      20   0       0      0      0 I   0.0   0.0   0:00.07 kworker/u128:1-events_unbound
     12 root      20   0       0      0      0 I   0.0   0.0   0:00.00 rcu_tasks_kthre
     13 root      20   0       0      0      0 I   0.0   0.0   0:00.00 rcu_tasks_rude_
     14 root      20   0       0      0      0 I   0.0   0.0   0:00.00 rcu_tasks_trace
     15 root      20   0       0      0      0 S   0.0   0.0   0:00.00 ksoftirqd/0
     16 root      20   0       0      0      0 S   0.0   0.0   0:00.33 pr/tty0
     17 root      20   0       0      0      0 I   0.0   0.0   0:00.40 rcu_preempt
     18 root      rt   0       0      0      0 S   0.0   0.0   0:00.01 migration/0
     19 root     -51   0       0      0      0 S   0.0   0.0   0:00.00 idle_inject/0
     21 root      20   0       0      0      0 S   0.0   0.0   0:00.00 cpuhp/0
     22 root      20   0       0      0      0 S   0.0   0.0   0:00.00 cpuhp/1
     23 root     -51   0       0      0      0 S   0.0   0.0   0:00.00 idle_inject/1
     24 root      rt   0       0      0      0 S   0.0   0.0   0:00.20 migration/1
     25 root      20   0       0      0      0 S   0.0   0.0   0:00.00 ksoftirqd/1
     27 root       0 -20       0      0      0 I   0.0   0.0   0:00.00 kworker/1:0H-events_highpri
     28 root      20   0       0      0      0 S   0.0   0.0   0:00.00 cpuhp/2
     29 root     -51   0       0      0      0 S   0.0   0.0   0:00.00 idle_inject/2
     30 root      rt   0       0      0      0 S   0.0   0.0   0:00.18 migration/2
     31 root      20   0       0      0      0 S   0.0   0.0   0:00.00 ksoftirqd/2
     32 root      20   0       0      0      0 I   0.0   0.0   0:00.00 kworker/2:0-rcu_par_gp
     33 root       0 -20       0      0      0 I   0.0   0.0   0:00.00 kworker/2:0H-events_highpri
     34 root      20   0       0      0      0 S   0.0   0.0   0:00.00 cpuhp/3
     35 root     -51   0       0      0      0 S   0.0   0.0   0:00.00 idle_inject/3
     36 root      rt   0       0      0      0 S   0.0   0.0   0:00.20 migration/3
     37 root      20   0       0      0      0 S   0.0   0.0   0:00.00 ksoftirqd/3
     39 root       0 -20       0      0      0 I   0.0   0.0   0:00.00 kworker/3:0H-events_highpri
     42 root      20   0       0      0      0 I   0.0   0.0   0:00.08 kworker/u128:3-flush-253:0
`

Hi @stefan1959, the router drops ping requests. When I get more time I’ll go in and see if I can forward the ICMP packets to the server.

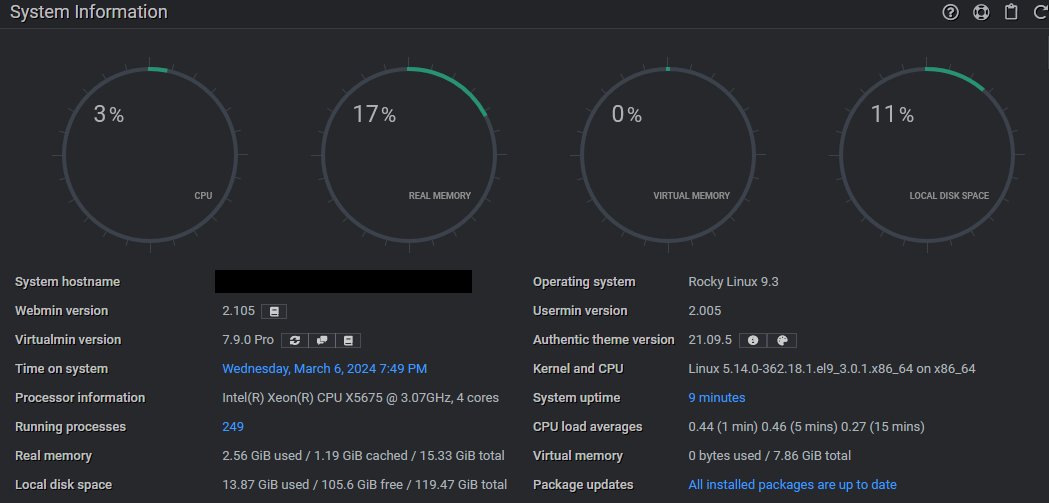
Some of the websites are WordPress and one is Cloudflare that is proxied through Webmin. When the sites timed out in the past, Apache still shows it is running fine in the dashboard.

Also use your inspect in your browser and the network tab. That can show useful stuff.

1 Like

I’ve got pings forwarded and have a window open for it. I’ll be back in a couple hours to see if anything has changed much.

I have had php quietly failing - resource issue. Try restarting php next time the websites fail.

1 Like

So far, it is quiet and the sites are working. Ping statistics are rough though:

Packets: Sent = 17339, Received = 14938, Lost = 2401 (13% loss),
Approximate round trip times in milli-seconds:
Minimum = 35ms, Maximum = 3547ms, Average = 61ms


And I just realized I have a VPN on a separate virtual server at the same location, so I’ll start ping tests on it as well, just as a comparison.

I won’t be able to perform many tests until later this afternoon, but I will be keeping an eye on things.

Maybe use tracert to see where the packet losses are happening.

It doesn’t look promising, as it appears to crap out after it exits my ISP’s private LAN.

Tracing route to zzz.com [aa.bb.cc.dd]
over a maximum of 30 hops:

  1    <1 ms    <1 ms    <1 ms  192.168.0.1
  2     *        1 ms     1 ms  100.65.51.1
  3     3 ms     3 ms     3 ms  100.126.2.17
  4    18 ms    17 ms    16 ms  100.126.0.81
  5     *        *        *     Request timed out.
  6     *        *        *     Request timed out.
  7     *        *        *     Request timed out.
  8     *        *        *     Request timed out.
  9     *        *        *     Request timed out.
 10     *        *        *     Request timed out.
 11     *        *        *     Request timed out.
 12     *        *        *     Request timed out.
 13     *        *        *     Request timed out.
 14     *        *        *     Request timed out.
 15    35 ms    34 ms    34 ms  aa-bb-cc-dd.googlefiber.net [aa.bb.cc.dd]

I’ll run a traceroute from work later this morning as well as it is on a completely separate network.

I should mention that when the the websites go down, it is down from every network, whether work, home, or cell. I can, however, connect to the VPN hosted on the same physical server without issue from those external networks.

Ping from home to Webmin gateway:

Packets: Sent = 8246, Received = 8125, Lost = 121 (1% loss),
Approximate round trip times in milli-seconds:
Minimum = 33ms, Maximum = 107ms, Average = 34ms

Ping from home to VPN:

Packets: Sent = 8250, Received = 8132, Lost = 118 (1% loss),
Approximate round trip times in milli-seconds:
Minimum = 33ms, Maximum = 389ms, Average = 34ms

So some loss, but not like it was last night.

You shouldn’t see any loss at all, maybe the router need a reboots if you have control of that.

From work, this is the result, which is more like it and is what I had expected:

Packets: Sent = 31655, Received = 31647, Lost = 8 (0% loss), TTL=47
Approximate round trip times in milli-seconds:
Minimum = 36ms, Maximum = 386ms, Average = 68ms

So I already knew that my home had problems connecting to this particular server. My ISP blames Google, and Google blames my ISP. Here’s the results from home:

Packets: Sent = 19614, Received = 15312, Lost = 4302 (21% loss),
Approximate round trip times in milli-seconds:
Minimum = 33ms, Maximum = 328ms, Average = 34ms

So when the timeouts occur on the websites, as mentioned before, it doesn’t matter whether I’m home, at work, or on the cell. When they go down, they are truly down. I can’t even access them from the same local network on the server.

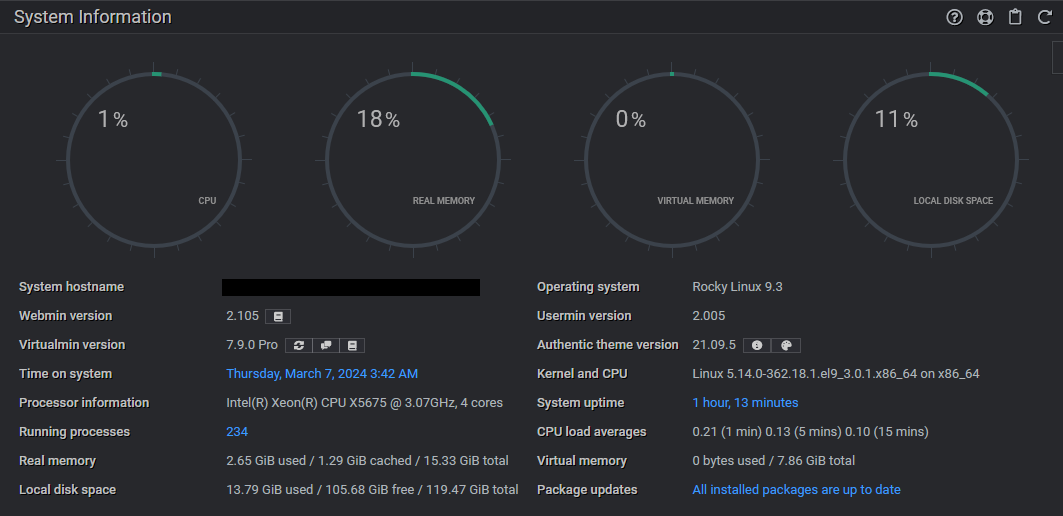
It looks like things are working so far okay today, so I’ll just keep an eye on things again.

Right, sound like a router somewhere is faulty. Your test from work I think proves it not google.
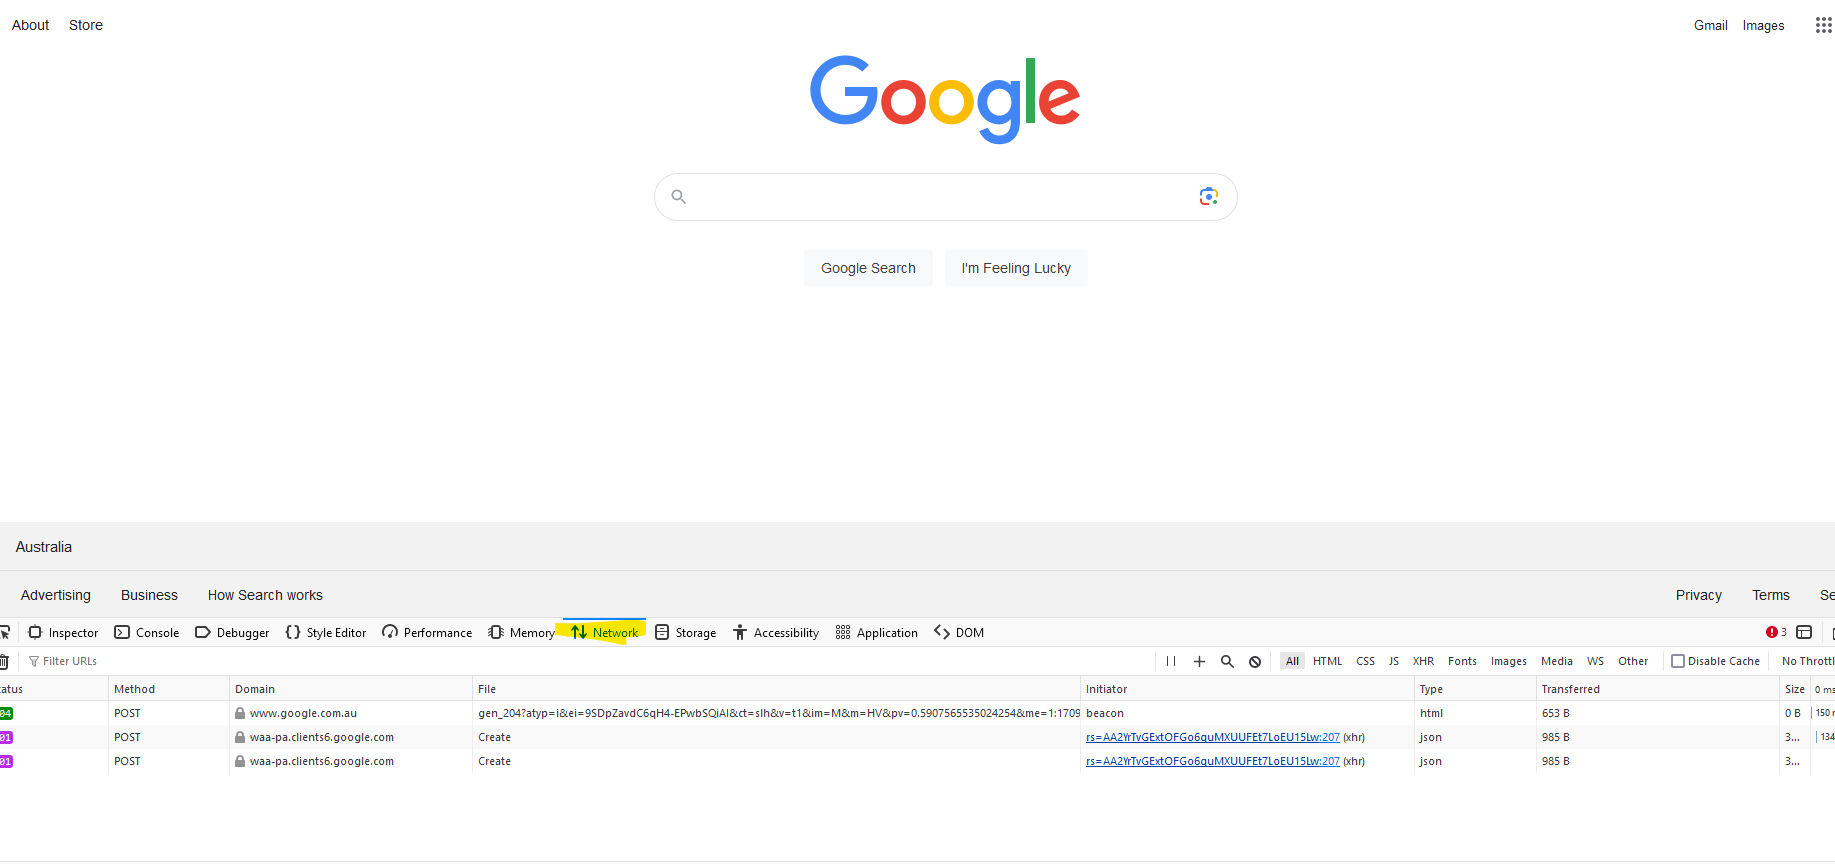
But with the website I think using using Inspect (on the browser) and network tab should show where the issue is there, if its a separate issue.
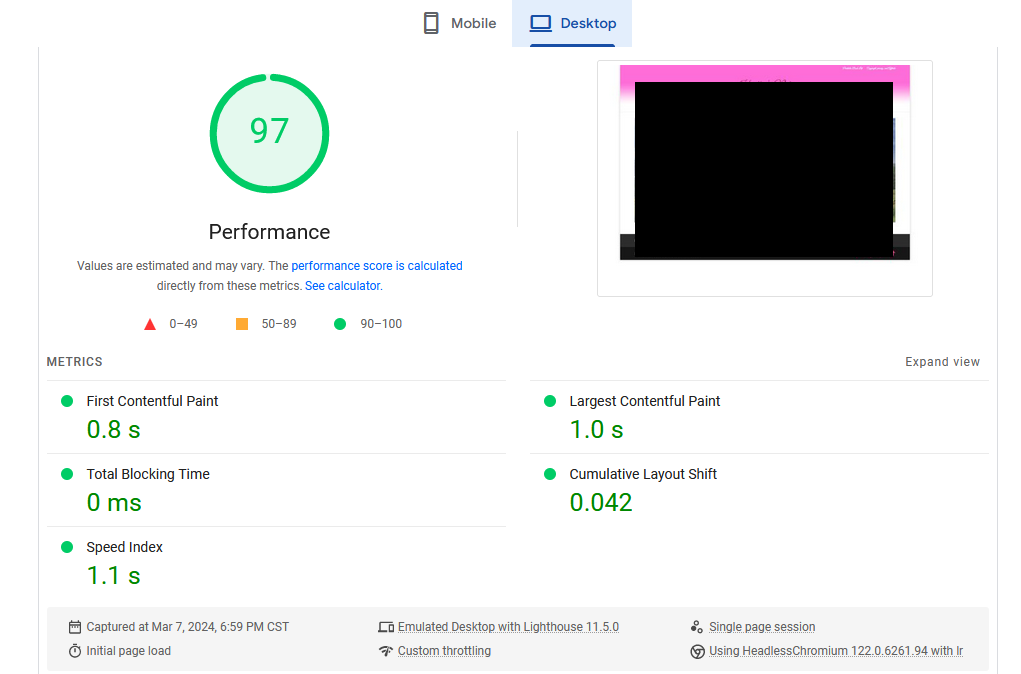
Also use page speed testing website, then its not using your network.
https://pagespeed.web.dev/

1 Like

When I start to see failure, I’ll try the PHP reboot and see how it responds.

Again a baseline:

And my ISP has finally scheduled a work order for Wednesday next week to look at the problems I’m having from home!

1 Like

You have a lot of packet loss %13 is quite a lot. Have you been able to solve that

1 Like

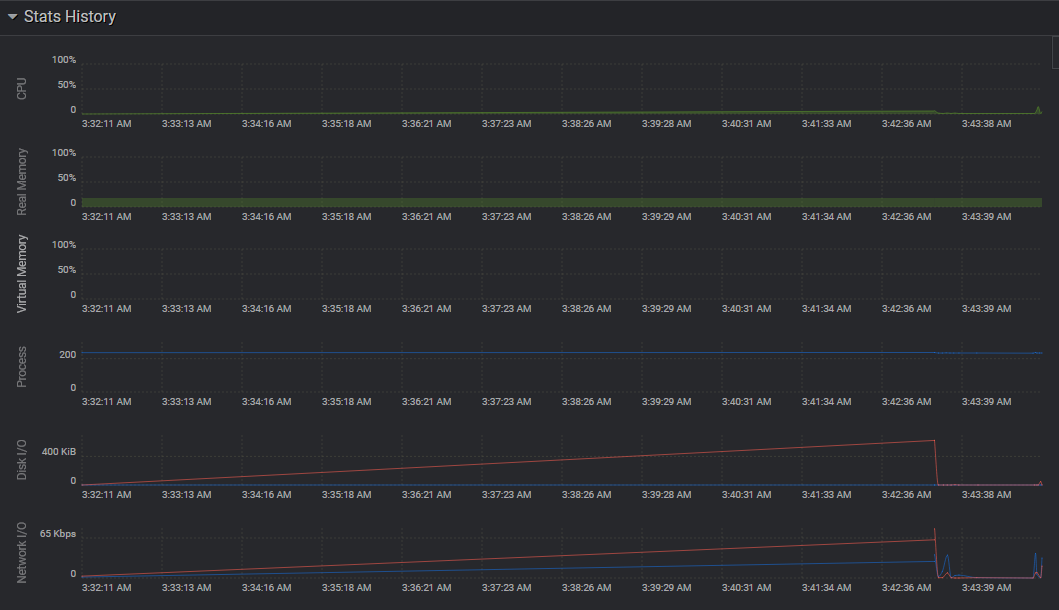
I found a couple of scans that were going in the background from WordPress that seem to have been the cause. I dropped one that never should have been set up, and I set the other to use fewer resources. I haven’t seen any timeouts since.