Is it possible to get a legend added to the bottom of graphs so we know which way is in and out or write and read … otherwise they are just pretty lines … and I have to keep remembering whats what … ![]()
Thanks
Is it possible to get a legend added to the bottom of graphs so we know which way is in and out or write and read … otherwise they are just pretty lines … and I have to keep remembering whats what … ![]()
Thanks
Hello,
That sounds like a good improvement! I’ll take a closer look and update this ticket with my progress.
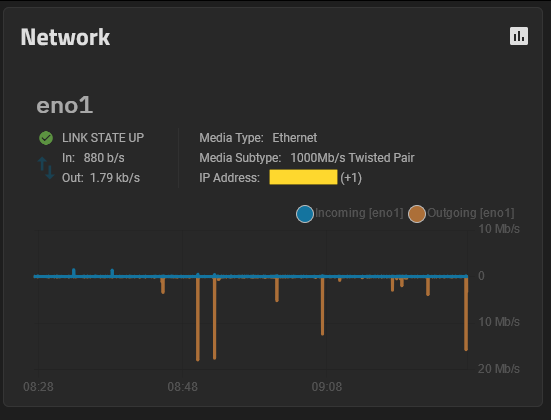
it would be a nice improvement, but just for kicks here is how it looks in TrueNAS.
This is incredibly difficult to implement!
what’s hard ?.. what I’m I missing ?
If the code is GPL your welcome to do it ![]() I think Ilia might be talking about the screen shot.
I think Ilia might be talking about the screen shot.
Yeah, that’s over the top as we already have the graph … I just need a couple of words added to remind me what colour is what
unlike that screenshot I don’t think there is any current differentiation between in/out (read/write) so that might be the problem.
or am I misunderstanding? I only get colours when the cpu/memory graphs hit high levels (occasionally)
this more for the network I/O
virtualmin image: the network in/out has different coloured lines.
Truenas: below the line in orange is outgoing, above the line is in blue incoming. (personally i would liek these reversed on truenas)
Looks nice, a welcome addition, thanks
Yes, exactly! I don’t really like it either! I’ll go with In and Out instead. I initially used Fetch because Received didn’t seem to fit well in terms of width.
Send / Recv is a pair that is often used. But In/Out is just as good.

