Latency Issues with Apache2/PHP/MariaDB on Debian 12 with Webmin/Virtualmin on new server

SYSTEM INFORMATION
OS type and version Debian 12
Webmin version 2.111
Virtualmin version 7.10.0

Hi,

Since December 2023, I’ve been using Webmin and Virtualmin (always up to date) on a Debian 12 system. Previously, and since 2010, I was using CentOS with Cpanel/Whm. Since switching to Debian 12 with Virtualmin, I’ve encountered a problem that didn’t occur on CentOS. It seems there is an issue with the responsiveness of Apache2 and/or PHP and/or MariaDB and/or Debian 12 itself. Here are the symptoms I’m experiencing:

From time to time, the PHP/HTTP/MariaDB APIs are slow to respond, with significant latency, as if something needs to wake up the first time of the day or after a long period of inactivity on the server. There’s a noticeable lag, but it doesn’t happen with websites or pages, only with certain very specific APIs, especially where there are many users. I always feel like it’s related to Apache, PHP, or MariaDB, but I have no idea. The dedicated server with Debian 12 and Webmin/Virtualmin was set up normally with Apache2 (not Nginx), and I just wanted to know if there’s a known configuration setting I might have missed. Maybe there’s also an issue with Bind, I’m not sure. Something isn’t right and it’s related to latency. If you access a site, everything runs smoothly, but it seems that if a page is called from an iframe or a webview, or remotely, there’s a latency as it searches for at least 2 minutes, and then it works consistently after that. Sometimes I have to wait 1 hour, 6 hours, or until the next day for it to happen again. I don’t understand. Do you have any idea what the problem might be?

Thank you.

All this distills down to the fact that you have intermittent lag on your server.

This has nothing to do with CentOS, cPanel, Virtualmin or much of the stuff you have mentioned because latency can be caused by a number of factors unrelated to Virtualmin.

There are tools which measure latency and performance but since you have an issue which is intermittent, this requires the archiving of logs and then analysing them closely. It would be difficult to guess the cause of the latency on your system without looking at logs over time.

Hello,

Thanks for choosing Virtualmin!

It’s difficult to pinpoint the exact bottleneck, but there are several configuration options to check.

For Apache, ensure MPM is set to event and not prefork by running apachectl -V | grep MPM. Check that KeepAlive is enabled and configured properly with MaxKeepAliveRequests and KeepAliveTimeout directives.

For PHP, ensure you’re using PHP-FPM execution mode. Verify that PHP process manager mode and PHP service maximum sub-processes options are correctly configured in the Web Configuration ⇾ PHP Options page. Also, ensure opcache isn’t disabled.

Despite possible issues with Apache and PHP, I suspect the issue may lie in the MariaDB configuration. If your system has sufficient memory, allocate more resources to MariaDB. The easiest way to do this is to re-run the Virtualmin wizard, farther to optional features section, and configure MariaDB for large systems.

Additionally, check our tutorial on configuring services for low memory systems. Even if your system isn’t low on memory, the article provides relevant insights and can help identify potential areas to examine:

Since we are guessing the cause, look out for any cron jobs which may cause the system to slow down while they run.

The cause of the intermittent latency could be a cron job.

Well, it could be anything in-fact.

Here are the current statuses (I haven’t changed anything yet):

MPM is a prefork

debian@ns:~$ sudo apachectl -V | grep MPM
Server MPM: prefork
debian@ns:~$

KeepAlive is off
MaxKeepAliveRequests is 500
KeepAliveTimeout is 5
PHP FPM is enabled on all sites
Opcache does not appear to be enabled

Regarding cron jobs, there aren’t many, except for numerous lines like this:

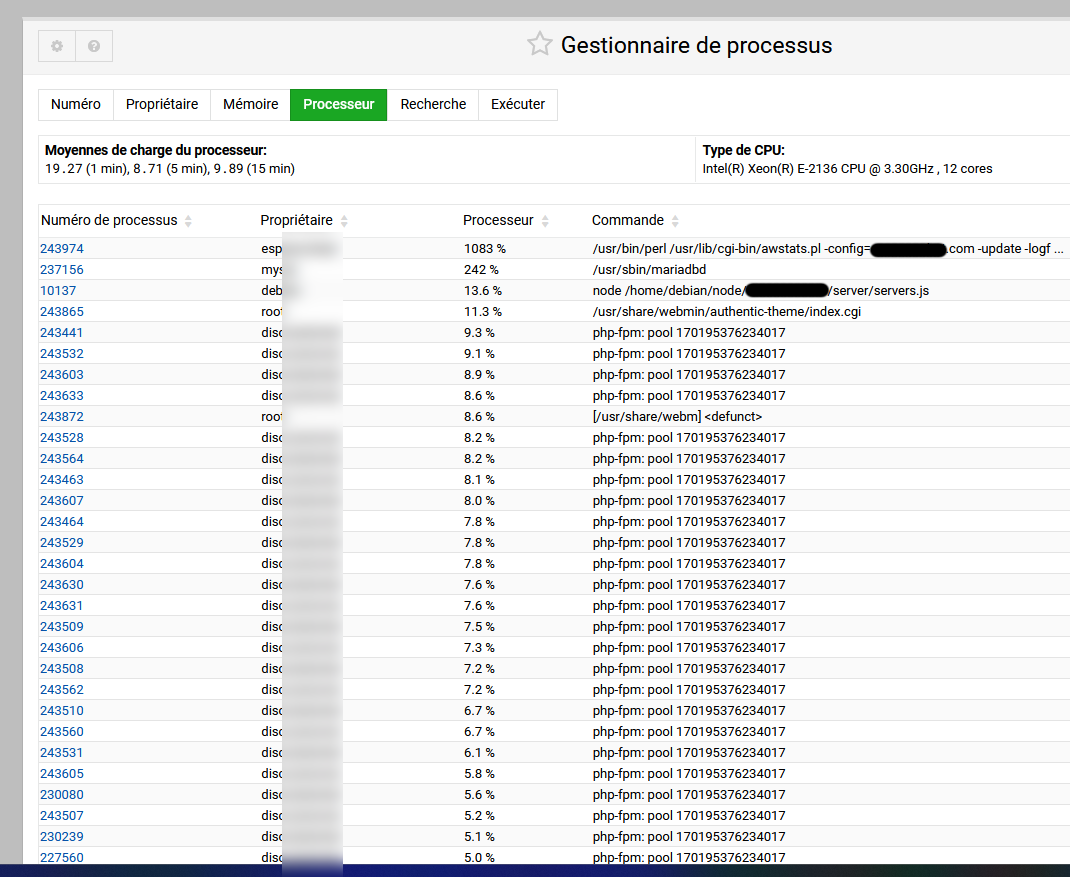
/etc/webmin/virtualmin-awstats/awstats.pl thesite.com

There are 45 of these, but there could be 10 more that I haven’t counted. Maybe it would be better to disable Awstats since I don’t use it?!
If I ignore all the Awstats entries, there are barely 10 to 15 cron jobs left, and to me, it doesn’t seem to be a problem, except for all the Awstats entries.

About Swap! Oh yes, I remember back in December 2023, I had issues with it initially, before putting the dedicated server into production. I had to reinstall the server twice because the swap was incorrectly set in the partition, only 500MB, and then I was advised to disable the swap. However, it was set to a new value, which I don’t know. I followed this tutorial: Swappiness ou comment utiliser au maximum sa Ram | Linux et Geekeries and the swappiness was set to 0. I was recommended to disable it, but should I have? I have a total of 32GB of memory on the dedicated server. I don’t remember the partition’s “swap” size, I have no idea. I’m really not knowledgeable about Swap.
Here is the current memory status: Real memory: 18.67GB used / 7.92GB cached / 31.12GB total
There are about 40 sites in total, not counting the subdomains, which could bring the total to 80 sites.
There are between 13,000 and 20,000 visitors spread across all sites each day.

Here is the configuration of MariaDB:

# The MariaDB configuration file
#
# The MariaDB/MySQL tools read configuration files in the following order:
# 0. "/etc/mysql/my.cnf" symlinks to this file, reason why all the rest is read.
# 1. "/etc/mysql/mariadb.cnf" (this file) to set global defaults,
# 2. "/etc/mysql/conf.d/*.cnf" to set global options.
# 3. "/etc/mysql/mariadb.conf.d/*.cnf" to set MariaDB-only options.
# 4. "~/.my.cnf" to set user-specific options.
#
# If the same option is defined multiple times, the last one will apply.
#
# One can use all long options that the program supports.
# Run program with --help to get a list of available options and with
# --print-defaults to see which it would actually understand and use.
#
# If you are new to MariaDB, check out https://mariadb.com/kb/en/basic-mariadb-articles/

#
# This group is read both by the client and the server
# use it for options that affect everything
#
[client-server]
# Port or socket location where to connect
# port = 3306
socket = /run/mysqld/mysqld.sock

# Import all .cnf files from configuration directory
#!includedir /etc/mysql/conf.d/
#!includedir /etc/mysql/mariadb.conf.d/


[mysqld]
#user                            = root
max_allowed_packet              = 1024M
max_connect_errors              = 1000000
performance-schema=0
default-storage-engine=InnoDB

# === InnoDB Settings ===
#default_storage_engine          = InnoDB
#innodb_buffer_pool_instances    = 4     # Use 1 instance per 1GB of InnoDB pool size - max is 64
innodb_buffer_pool_size         = 4G    # Use up to 70-80% of RAM
innodb_file_per_table           = 1
innodb_flush_log_at_trx_commit  = 0
innodb_flush_method             = O_DIRECT
innodb_log_buffer_size          = 16M
innodb_log_file_size            = 1G
innodb_sort_buffer_size         = 4M    # UPD - Defines how much data is read into memory for sorting operations before writing to disk (default is 1M / max is 64M)
innodb_stats_on_metadata        = 0
#innodb_use_fdatasync           = 1     # Only (!) for MySQL v8.0.26+

#innodb_temp_data_file_path     = ibtmp1:64M:autoextend:max:20G # Control the maximum size for the ibtmp1 file
#innodb_thread_concurrency      = 4     # Optional: Set to the number of CPUs on your system (minus 1 or 2) to better
                                        # contain CPU usage. E.g. if your system has 8 CPUs, try 6 or 7 and check
                                        # the overall load produced by MySQL/MariaDB.
innodb_read_io_threads          = 64
innodb_write_io_threads         = 64
#innodb_io_capacity             = 2000  # Depends on the storage tech - use 2000 for SSD, more for NVMe
#innodb_io_capacity_max         = 4000  # Usually double the value of innodb_io_capacity


# === MyISAM Settings ===
# The following 3 options are ONLY supported by MariaDB & up to MySQL 5.7
# Do NOT un-comment on MySQL 8.x+
#query_cache_limit              = 4M    # UPD
#query_cache_size               = 64M   # UPD
#query_cache_type               = 1     # Enabled by default

key_buffer_size                 = 24M   # UPD

low_priority_updates            = 1
concurrent_insert               = 2


# === Connection Settings ===
max_connections                 = 1000   # UPD - Important: high no. of connections = high RAM consumption


back_log                        = 512
thread_cache_size               = 100
thread_stack                    = 192K

interactive_timeout             = 180
wait_timeout                    = 180

# For MySQL 5.7+ only (disabled by default)
#max_execution_time             = 90000 # Set a timeout limit for SELECT statements (value in milliseconds).
                                        # This option may be useful to address aggressive crawling on large sites,
                                        # but it can also cause issues (e.g. with backups). So use with extreme caution and test!
                                        # More info at: https://dev.mysql.com/doc/refman/5.7/en/server-system-variables.html#sysvar_max_execution_time

# For MariaDB 10.1.1+ only (disabled by default)
#max_statement_time             = 90    # The equivalent of "max_execution_time" in MySQL 5.7+ (set above)
                                        # The variable is of type double, thus you can use subsecond timeout.
                                        # For example you can use value 0.01 for 10 milliseconds timeout.
                                        # More info at: https://mariadb.com/kb/en/aborting-statements/

# === Buffer Settings ===
# Handy tip for managing your database's RAM usage:
# The following values should be treated carefully as they are added together and then multiplied by your "max_connections" value.
# Other options will also add up to RAM consumption (e.g. tmp_table_size). So don't go switching your "join_buffer_size" to 1G, it's harmful & inefficient.
# Use one of the database diagnostics tools mentioned at the top of this file to count your database's potential total RAM usage, so you know if you are within
# reasonable limits. Remember that other services will require enough RAM to operate properly (like Apache or PHP-FPM), so set your limits wisely.
join_buffer_size                = 4M    # UPD
read_buffer_size                = 3M    # UPD
read_rnd_buffer_size            = 4M    # UPD
sort_buffer_size                = 4M    # UPD

# === Table Settings ===
# In systemd managed systems like Ubuntu 16.04+ or CentOS 7+, you need to perform an extra action for table_open_cache & open_files_limit
# to be overriden (also see comment next to open_files_limit).
# E.g. for MySQL 5.7, please check: https://dev.mysql.com/doc/refman/5.7/en/using-systemd.html
# and for MariaDB check: https://mariadb.com/kb/en/library/systemd/
table_definition_cache          = 40000 # UPD
table_open_cache                = 40000 # UPD
open_files_limit                = 60000 # UPD - This can be 2x to 3x the table_open_cache value or match the system's, or 60000
                                        # open files limit usually set in /etc/sysctl.conf and /etc/security/limits.conf
                                        # In systemd managed systems this limit must also be set in:
                                        # - /etc/systemd/system/mysql.service.d/override.conf (for MySQL 5.7+ in Ubuntu) or
                                        # - /etc/systemd/system/mysqld.service.d/override.conf (for MySQL 5.7+ in CentOS) or
                                        # - /etc/systemd/system/mariadb.service.d/override.conf (for MariaDB)
                                        # otherwise changing open_files_limit will have no effect.
                                        #
                                        # To edit the right file execute:
                                        # $ systemctl edit mysql (or mysqld or mariadb)
                                        # and set "LimitNOFILE=" to something like 100000 or more (depending on your system limits for MySQL)
                                        # or use "LimitNOFILE=infinity" for MariaDB only.
                                        # Finally merge the changes with:
                                        # $ systemctl daemon-reload; systemctl restart mysql (or mysqld or mariadb)

max_heap_table_size             = 256M  # Increase to 256M or 512M if you have lots of temporary tables because of missing indices in JOINs
tmp_table_size                  = 256M  # Use same value as max_heap_table_size

# === Search Settings ===
ft_min_word_len                 = 3     # Minimum length of words to be indexed for search results

# === Binary Logging ===
disable_log_bin                 = 1     # Binary logging disabled by default
#log_bin                                # To enable binary logging, uncomment this line & only one of the following 2 lines
                                        # that corresponds to your actual MySQL/MariaDB version.
                                        # Remember to comment out the line with "disable_log_bin".
#expire_logs_days               = 1     # Keep logs for 1 day - For MySQL 5.x & MariaDB before 10.6 only
#binlog_expire_logs_seconds     = 86400 # Keep logs for 1 day (in seconds) - For MySQL 8+ & MariaDB 10.6+ only

event_scheduler=1

# fin

# === SQL Compatibility Mode ===
# Enable for b/c with databases created in older MySQL/MariaDB versions
# (e.g. when using null dates)
#sql_mode                       = ERROR_FOR_DIVISION_BY_ZERO,NO_AUTO_CREATE_USER,NO_ENGINE_SUBSTITUTION,ONLY_FULL_GROUP_BY,STRICT_TRANS_TABLES
# Crappy SQL queries/schema? Go bold!
sql_mode=""

local-infile=1


# === Error & Slow Query Logging ===
log_error                       = /var/log/mariadb/mysql_error.log
log_queries_not_using_indexes   = 0     # Disabled on production
long_query_time                 = 5
slow_query_log                  = 0     # Disabled on production
slow_query_log_file             = /var/log/mariadb/mysql-slow.log

#general_log = 1
#general_log_file = /var/log/mariadb/mysql.log


[mysqldump]
# Variable reference
# For MySQL 5.7+:  https://dev.mysql.com/doc/refman/5.7/en/mysqldump.html
# For MariaDB:     https://mariadb.com/kb/en/library/mysqldump/
quick
quote_names
max_allowed_packet              = 1024M

For Apache, should I apply everything you mentioned, or are there any new ideas based on the information I’ve provided?

If you don’t remember switching to prefork, this also happens automatically if you installed mod_php (which you should never do). See PHP Execution Modes | Virtualmin — Open Source Web Hosting Control Panel for instructions on removing mod_php, if you have installed it.

prefork is slower and more resource intensive, but it’s unlikely to explain any notable latency. Especially at your tiny usage. Apache can serve 20,000 daily visitors with both hands tied behind its back and blindfolded. It’s impossible for the web server in any configuration to explain your latency problem. You should fix it if you have mod_php installed, because it is a security issue in addition to a performance issue, but that’s unrelated to your performance issue.

You need to narrow down where the problem is occurring, and you can, with about 99% certainty, ignore Apache as a possible culprit.

There are way too many variables here.

Confirm it’s not the web server by requesting a static file when the latency is happening. I assume a static file will load instantly, if the problem is database or something else. Note that if a static file doesn’t load instantly, it doesn’t necessarily indicate the web server is slow (probably doesn’t, in fact), but probably points to a system limits problem of some sort. (e.g. something like semaphore limits: Apache 2.4 - process hanging intermittently - Server Fault )

If this is a problem it would show up in the error_log, as well. I assume you’re looking at the error_log already for all the sites exhibiting this problem? You always need to look at logs.

You might consider turning on slow query logging in mariadb. Slow Query Log Overview - MariaDB Knowledge Base

Again, logs are where you look for problems. Almost any component is going to tell you if it’s running into resource limits.

Your system is big enough, and your usage low enough, that tuning should not be necessary unless something is pathological in one or more of your sites.

Do you have Cloudflare in front of your sites? It can introduce surprising latency, for a variety of reasons (it sometimes makes things a little faster for some visitors, but it can also make things slower).

If one or more of your DNS servers is down, that can also introduce latency for some services, especially with a short TTL on records.

But, you need to figure out what’s going wrong before you start trying to fix it. This question is way too vague. Don’t start tweaking mariadb configuration without knowing mariadb is where the problem happens. (Though, again, you should definitely fix it, if you have installed mod_php, but that’s not gonna solve long intermittent latency problems.)

It’s probably not cronjobs, but you can find out exactly when cronjobs run, and if it turns out one or more of them are running when you see latency, you may have found your culprit.

The mod_php does not seem to be installed:

debian@ns:~$ apt-cache policy libapache2-mod-php7.4
libapache2-mod-php7.4:
  Installé : (aucun)
  Candidat : 1:7.4.33-13+0~20240606.93+debian12~1.gbp3bbf86
 Table de version :
     1:7.4.33-13+0~20240606.93+debian12~1.gbp3bbf86 500
        500 https://packages.sury.org/php bookworm/main amd64 Packages
debian@ns:~$


debian@ns:~$ apt-cache policy libapache2-mod-php8.2
libapache2-mod-php8.2:
  Installé : (aucun)
  Candidat : 8.2.20-2+0~20240608.57+debian12~1.gbp6b5ea6
 Table de version :
     8.2.20-2+0~20240608.57+debian12~1.gbp6b5ea6 500
        500 https://packages.sury.org/php bookworm/main amd64 Packages
     8.2.20-1~deb12u1 500
        500 mirror+file:/etc/apt/mirrors/debian-security.list bookworm-security/main amd64 Packages
     8.2.7-1~deb12u1 500
        500 mirror+file:/etc/apt/mirrors/debian.list bookworm/main amd64 Packages

debian@ns:~$ apt-cache policy libapache2-mod-php8.3
libapache2-mod-php8.3:
  Installé : (aucun)
  Candidat : 8.3.8-2+0~20240608.35+debian12~1.gbp4d7dbc
 Table de version :
     8.3.8-2+0~20240608.35+debian12~1.gbp4d7dbc 500
        500 https://packages.sury.org/php bookworm/main amd64 Packages

debian@ns:~$ apt-cache policy libapache2-mod-php
libapache2-mod-php:
  Installé : (aucun)
  Candidat : 2:8.3+94+0~20240205.51+debian12~1.gbp6faa2e
 Table de version :
     2:8.3+94+0~20240205.51+debian12~1.gbp6faa2e 500
        500 https://packages.sury.org/php bookworm/main amd64 Packages
     2:8.2+93 500
        500 mirror+file:/etc/apt/mirrors/debian.list bookworm/main amd64 Packages
debian@ns:~$

I set the apache MPM to event and removed prefork.
I also repaired php codes/errors, there are fewer and fewer of them.
I’ll see what I can do next

Thank you for your help, I still prefer Virtualmin/webmin, rather than cpanel/whm

1 Like

I had to revert MPM to prefork because with the event MPM, Apache experiences some sort of freeze. It takes a long time to load for all the sites, but it’s impossible to connect even after 10 minutes. No sites are functioning at all.

I saw an error line in the logs:

server reached MaxRequestWorkers setting, consider raising the MaxRequestWorkers setting

I tried several values without success, so I switched back to prefork. This is probably why I selected prefork when I installed the server in December; I likely had issues with this before and copied the configurations from CentOS/WHM.

The configuration in /etc/apache2/apache2.conf, I had set it to this for event:

KeepAlive On

ServerLimit 1020
MaxRequestWorkers 1020
MaxConnectionsPerChild 50000

MaxKeepAliveRequests 100

KeepAliveTimeout 5

with mpm prefork it’s the same thing, but I had to put KeepAlive to Off. I don’t know why, but I couldn’t leave it On

@Joe

Do you have Cloudflare in front of your sites? It can introduce surprising latency, for a variety of reasons (it sometimes makes things a little faster for some visitors, but it can also make things slower).

Yes, there are about 10 sites with their proxies/DNS routed through Cloudflare to my server. Should any of them be removed? Or should the repair be done on the Cloudflare side or the Debian side?

I think you should test without Cloudflare, to rule it out as the source of your problems.

The website (domain name) I test the most (live site) is not under Cloudflare. It’s a high-traffic and important site, and sometimes I feel lag on it. The other smaller sites are under Cloudflare. Could they be slowing down the site that isn’t under Cloudflare?

Anyway, I’ve made some corrections such as:

Disabled antivirus (ClamAV) and spam assassin.
Fixed the most buggy PHP codes that appeared in the error_log of the domains.
Changed some MySQL connections from localhost to 127.0.0.1.

I find it’s better now; it’s consuming less memory. It’s hovering around 50% memory usage. Previously, it would sometimes reach 70% (shown in orange) during rush hour. I’m afraid it will rise again to 60%. Is it risky / can it break things if it exceeds 50%?

Well done.

In addition to Virtualmin’s Dashboard, you can get information about memory consumption and CPU usage with the top command. You should give that a go.

The top panel blinks a lot to refresh, I tried to check the CPU spikes for MariaDB, is it normal for it to be over 100%?

Yes, top output is near realtime so the screen refreshes every few seconds with new data.

If you have a beefy CPU with many cores then it is okay to have a process show over 100% CPU usage in top. But does your visitor log justify this? Do you have like a thousand visitors per hour during that time?

Currently 450 in a chat community with a dedicated interface, and perhaps between 50 and 400 spread across all the other sites, around a thousand, there really isn’t more, it’s simultaneous.

I would then say that your cpu usage for the database is not inordinate

So, we know it’s the database that is probably the cause of slowness.

Have you turned on slow query logging to find out which apps and which queries (thus which plugins or whatever code) is causing the slowdown? (Note that slow query logging is a debugging measure, it doesn’t need to be left on all the time. You just need to figure out what’s wrong, so you can fix it.)

Tuning your Mariadb caching configuration to suit your application workload may also be appropriate.

Hi

On the Webmin home page, I saw that it was at 100% and I clicked on it, there is this:

Currently it’s peak time for a site, and it’s making the site and other sites mess up, sometimes pages show a loading error, some sort of page unavailable.

For me on the screen that I showed you, I can’t see if there is a problem.

The server has a maximum total memory of 32GB, and the processor has 12 cores.