I’ve been scratching my head over the fact that the CPU load stat on the Webmin dashboard is always way too high, and never matches the CPU load shown in Activity Monitor. It looks to me like Webmin is using an additive load across all CPU cores (six in this case) to arrive at its load value; e.g., if one core is at 100% and the rest are at 5% each, Webmin will show 125% CPU load. In reality, it should probably divide that by the number of cores to get the average CPU load.
The numbers for “CPU load averages” match uptime, but the CPU graph doesn’t seem to be tied to those numbers, it looks more like it’s doing an aggregate of percentages from top or some such. It’s obviously not considering the number of available cores. That number is available via “sysctl -n hw.ncpu” so it could be utilized for an accurate graph.
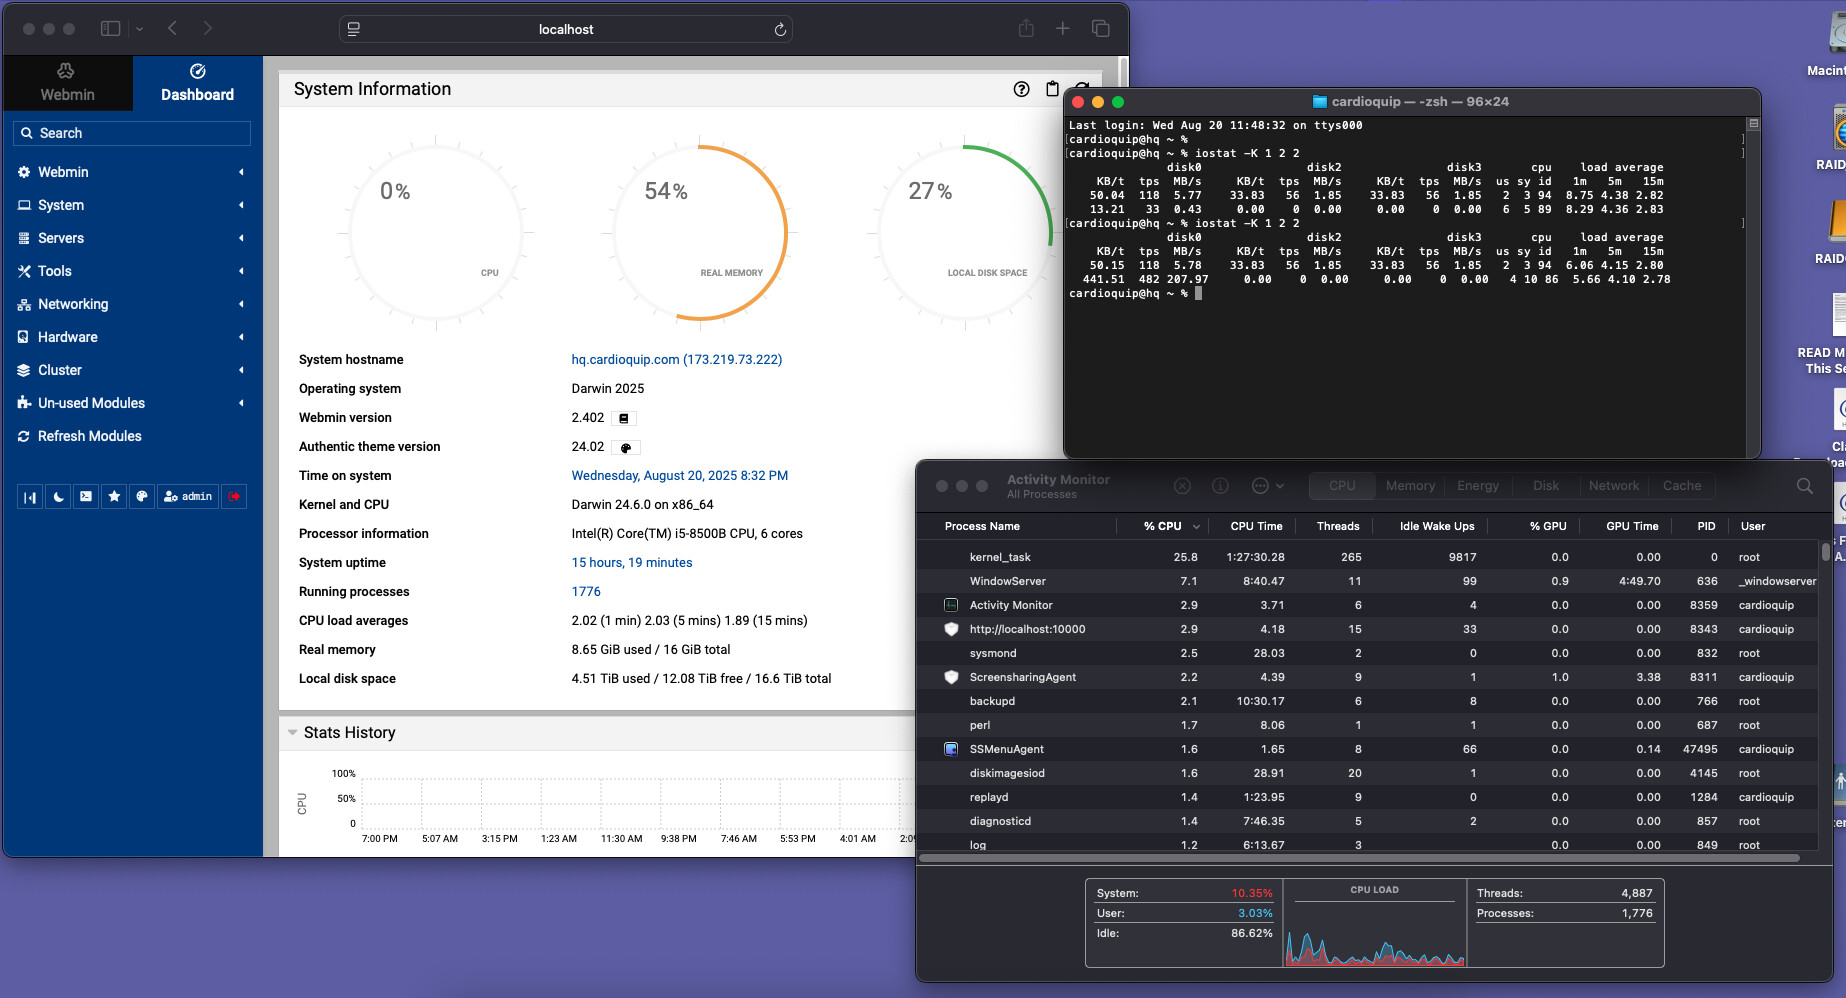
From the “keeps getting weirder” department, now the graph shows zero. It was something like 130% when I first opened the window, then it went to zero and is staying there. You can see that iostat, Activity Monitor, and the “CPU load averages” are tracking, but that graph has a mind of its own.
The confusing part may be here is that unless the browser window is focused (in the foreground) the stats won’t update.
The updating of the stats stops about 3-5 seconds after the window loses focus.
What you can do to test it is run a CPU-intensive process in the background, then focus back on the browser window to see if they are updating correctly.
Focus doesn’t seem to matter, as I can refresh the browser window to no effect.
At the end of the day, this issue probably isn’t worth any of our time; if I’m concerned about CPU stats, I’ll be using top or iostat, not this graph. It’s just one of those “if it’s there, it ought to at least be sort of accurate” things.