We have the latest OS, packages, webmin and virtualmin versions. Also PHP 5.6 and all of 7.x versions installed. Install options was Minimal Virtualmin and installed awstats. There are ~150 domains on server and all of them using FPM on apache (nginx not installed)
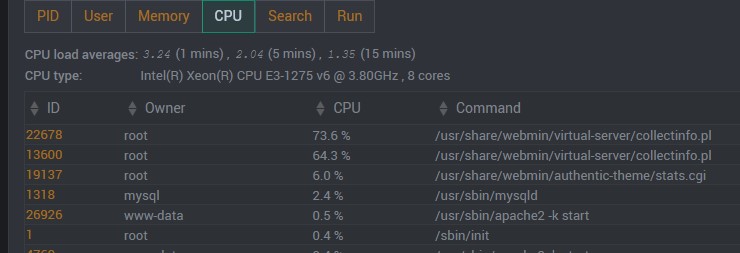
As you can see on this old thread (collectinfo.pl makes %100 CPU [#54532] | Virtualmin), we are having issue with collectinfo.pl while it’s activated. Every 15 mins (we defined collection time as 15 mins) it created collectinfo.pl instance which is a never finished task.
After 15 mins, here’s the two instance running same time:
Could you strace the process with children, saving the output to a file, archiving it and sending it to us, so it would be evident, where is the actual bottleneck?
@Jamie Jamie, shouldn’t we check before running another instance of collectinfo.pl if the previous process was finished? Perhaps additionally notifying a master administrator over email of a stuck process and possibly embedding more detailed report on what went wrong?
@Ilia I just disabled info collecting after one instance started. Now only one instance of collectinfo.pl is running and local disk space usage statistic is dropping 10 MB by every 3 seconds (more or less).
I have had disabled info collecting for 3-4 months so maybe it’s clearing some things up but exactly I don’t know what.
This is our one of the prod. server so I can’t install extra packages but here’s the specs:
Do you run Webmin behind proxy or connecting using host:port directly? We are talking about automatic call of recollect, not manually triggered using Dashboard?
What is the simple output of :
ps aux |grep recollect.cgi
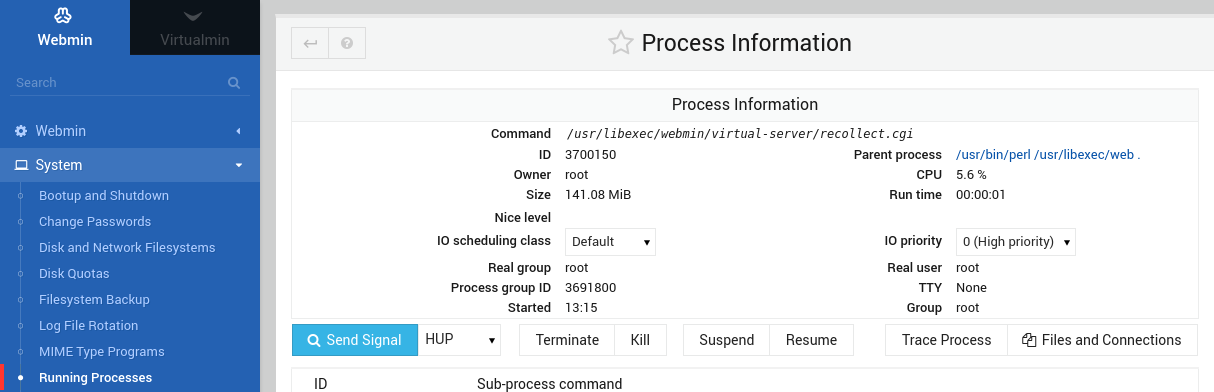
Moreover, what if you go to Webmin > System > Running Processes > PID, find collectinfo.pl process, click on it and then click on Trace Process. Additionally it would be interesting to see Files and Connections output.
We are not using proxy (connecting like host:port) and recollect running automatic. I’m not triggering it manually.
Btw, after 3-4 hours process instance finished and disk usage lowered nearly 20 GB. Recollecting now running as expected (every 15 mins) and finishing successfully.
But collectinfo.pl has an error about not running simultaneous instances so it hogs cpu resource if it taking too long for a single instance.