Cannot access VPS using SSH and no http, Webmin panel, mail, etc after months of regular use

This is a Contabo VPS where I host a few websites and mail server. (Almalinux 9)
I’ve been using it for years. A year ago I upgraded to a new VPS and moved old content to it.

Two days ago I started having problems with high Load values.

From Webmin I stopped some services to check if the problem was one of them. Access log files were extremely slow. Httpd, php-fph, Postfix, Dovecot were stopped and Load started decreasing but after a while it increased very high again at a point I had to reboot from Contabo’s panel. (ssh top was the reference)

Reboot from ssh was not possible (timeout or something like that)

After rebooting from Contabo’s panel, the system went fine for a couple of hours when the issue started again.

Another reboot and I couldn’t have ssh, http… anymore.

Now I am able to access the server via VNC Viewer, a bit odd to use its console (cannot write ‘|’ like “ls | grep…”. and don’t have “/” in my keyboard! °.

I think that during the mess something got corrupted.

From VNC, looking about the firewall I get


csf is already disabled after reboot. csf was always enabled, I received its mails about high CPU loads

Not sure if this is the main problem but I have to start fixing it.
What can I do?
Thank you

EDIT: Contabo fixes the network issue, csf starts at boot but the screenshot report ramains the same

I can’t understand how it’s still allowed to ask for help without a full description of the system used, memory capacity and so on…

AMD EPYC 7282 16-Core Processor, 4 cores
Operating system** AlmaLinux 9.3
Real memory 1.97 GiB used / 1.22 GiB cached / 7.49 GiB total
Virtual memory 69.96 MiB used / 511.99 MiB total
Local disk space 103.51 GiB used / 289.09 GiB free / 392.61 GiB total
Package updates All installed packages are up to date
Webmin version 2.105
Usermin version 2.005
Virtualmin version 7.9.0
Firewall version ConfigServer Security & Firewall 14.20
CPU load averages 0.42 (1 min) 0.35 (5 mins) 0.28 (15 mins)
Running processes 262

Looks ok, at present. If this is a csf issue maybe uninstall it and got back for firewalld
https://download.configserver.com/csf/install.txt (at bottom to uninstall.)

Use TOP cause high load when it happens.
This is where I’m glad I do daily backups. This would freak me out.

Today I received a notice from lgd
09:03

Time: Sun Jan 21 09:03:24 2024 -0300
1 Min Load Avg: 26.78
5 Min Load Avg: 6.86
15 Min Load Avg: 2.47
Running/Total Processes: 41/667

top showed decreasing Load values. This is the last one:
09:21

top - 09:21:49 up 1 day, 22:40, 2 users, load average: 0.40, 1.50, 6.21
Tasks: 272 total, 1 running, 270 sleeping, 0 stopped, 1 zombie
%Cpu(s): 6.4 us, 5.2 sy, 0.0 ni, 85.3 id, 0.0 wa, 0.0 hi, 0.2 si, 2.9 st
MiB Mem : 7673.4 total, 4461.9 free, 2656.4 used, 1158.4 buff/cache
MiB Swap: 512.0 total, 460.8 free, 51.2 used. 5017.0 avail Mem

09:02
cat /var/log/messages | grep -a "Jan 21 09:02"
I got a dozen of reports like this one:

Jan 21 09:02:19 host kernel: Firewall: TCP_IN Blocked IN=eth0 OUT= MAC=00:50:56:4a:27:fb:74:83:ef:4e:ad:b9:08:00 SRC=79.124.60.6 DST=xxx.xxx.xxx.xxx LEN=40 TOS=0x00 PREC=0x00 TTL=248 ID=14260 PROTO=TCP SPT=55407 DPT=1697 WINDOW=1024 RES=0x00 SYN URGP=0

So I manually added SRC IP to csf/lgd deny list

grep -Rnw '/var/log/' -e '79.124.60.6' --exclude 'messages*'
I only got this old record (including messages I get tons of records)

/var/log/maillog-20240121:51295:Jan 16 12:36:08 host dovecot[916]: imap-login: Disconnected: Connection closed: read(size=1007) failed: Connection reset by peer (no auth attempts in 0 secs): user=<>, rip=79.124.60.6, lip=xxx.xxx.xxx.xxx, session=

How can I know what was this guy doing or trying to do that Load values increased so high?
Thank you

First, I’d add them to the firewall and see if the problem goes away. I know Postfix can rate limit, but I don’t know if it is a default. Also, that would have to be a lot of connection attempts to spike usage. ‘Most’ spammer scripts aren’t stupid enough to kill a server. Kinda counter productive.

High Loads today were at 01:40 and at 09:03. After blocking that IP it remains calm (18:30 now).
I was trying to realize what could be happen during those times.
access_log of the most accessed by far doesn’t have suspicious activity, same as other access log and maillog

Back scatter wouldn’t look suspicious except for the volume. I don’t know your setup but if you have firewall capabilities before your server you could add that IP there.

Hi,
I don’t have that capability but after denying that IP it wasn’t listed in any log.

Anyway I had 2 high Load incidents during the night.
messages doesn’t show anything special but maillog
cat /var/log/maillog | grep -a "Jan 22 02:55"

Jan 22 02:55:24 host dovecot[16659]: imap(370620): Warning: Time jumped forwards 13.148630 seconds
Jan 22 02:55:24 host dovecot[16659]: imap(741686): Warning: Time jumped forwards 15.302095 seconds
Jan 22 02:55:24 host dovecot[16659]: imap(742618): Warning: Time jumped forwards 14.951173 seconds
Jan 22 02:55:24 host dovecot[16659]: imap(741770): Warning: Time jumped forwards 30.508542 seconds
Jan 22 02:55:24 host dovecot[16659]: imap(741769): Warning: Time jumped forwards 30.716913 seconds
Jan 22 02:55:24 host dovecot[16659]: imap(370622): Warning: Time jumped forwards 17.608744 seconds
postfix/smtpd[742615]: warning: TLS library problem: error:0A000126:SSL routines::unexpected eof while reading:ssl/record/rec_layer_s3.c:320:
Jan 22 02:55:24 host postfix/smtpd[742615]: lost connection after CONNECT from 201.130.128.222.ded.telnor.net[201.130.128.222]
Jan 22 02:55:24 host postfix/smtpd[742615]: disconnect from 201.130.128.222.ded.telnor.net[201.130.128.222] commands=0/0
Jan 22 02:55:24 host postfix/smtpd[742615]: connect from unknown[213.230.65.53]
Jan 22 02:55:24 host postfix/smtpd[742615]: SSL_accept error from unknown[213.230.65.53]: -1
Jan 22 02:55:24 host postfix/smtpd[742615]: warning: TLS library problem: error:0A000126:SSL routines::unexpected eof while reading:ssl/record/rec_layer_s3.c:320:
Jan 22 02:55:24 host postfix/smtpd[742615]: lost connection after CONNECT from unknown[213.230.65.53]
Jan 22 02:55:24 host postfix/smtpd[742615]: disconnect from unknown[213.230.65.53] commands=0/0

TLS library problem: error:0A000126:SSL routines::unexpected eof while reading:ssl/record/rec_layer_s3.c:320:

Time jumped forwards Consequence?


cat /var/log/lfd.log | grep -a "Jan 22 02:5"

Jan 22 02:50:39 host lfd[741866]: Suspicious Process PID:741683 PPID:811 User:dovenull Uptime:135 secs EXE:/usr/libexec/dovecot/imap-login CMD:dovecot/imap-login
Jan 22 02:51:54 host lfd[742106]: Suspicious Process PID:741746 PPID:811 User:dovenull Uptime:130 secs EXE:/usr/libexec/dovecot/imap-login CMD:dovecot/imap-login
Jan 22 02:51:54 host lfd[742106]: Suspicious Process PID:741748 PPID:811 User:dovenull Uptime:129 secs EXE:/usr/libexec/dovecot/imap-login CMD:dovecot/imap-login
Jan 22 02:51:54 host lfd[742106]: Suspicious Process PID:741854 PPID:811 User:dovenull Uptime:81 secs EXE:/usr/libexec/dovecot/imap-login CMD:dovecot/imap-login
Jan 22 02:54:18 host lfd[742587]: Suspicious Process PID:742314 PPID:811 User:dovenull Uptime:103 secs EXE:/usr/libexec/dovecot/imap-login CMD:dovecot/imap-login
Jan 22 02:55:24 host lfd[742719]: LOAD 5 minute load average is 6.30, threshold is 6 - email sent
Jan 22 02:55:30 host lfd[742771]: Suspicious Process PID:742608 PPID:811 User:dovenull Uptime:63 secs EXE:/usr/libexec/dovecot/imap-login CMD:dovecot/imap-login
Jan 22 02:55:44 host lfd[742790]: Child : Lock Error [PT_LOAD] still active - section skipped
Jan 22 02:56:23 host lfd[742771]: Excessive Processes User:postfix Kill:0 Process Count:11
Jan 22 02:57:09 host lfd[742875]: Child : Lock Error [PT_INTERVAL] still active - section skipped
Jan 22 02:59:27 host lfd[742930]: STATS: 15 sec. timeout performing iptables_log
Jan 22 02:59:29 host lfd[742929]: STATS: 15 sec. timeout performing iptables_log
Jan 22 02:59:33 host lfd[742934]: Hanging Lock by 528772 found for /var/lib/csf/lock/command.lock - terminated
Jan 22 02:59:36 host lfd[742926]: STATS: 15 sec. timeout performing iptables_log
Jan 22 02:59:54 host lfd[742925]: STATS: 15 sec. timeout performing iptables_log

tail -f /var/log/httpd/access_log

127.0.0.1 - - [21/Jan/2024:01:40:40 -0300] “GET /server-status HTTP/1.1” 404 196 “-” “csf/”
127.0.0.1 - - [21/Jan/2024:01:40:40 -0300] “GET /server-status HTTP/1.1” 404 196 “-” “curl/7.76.1”
127.0.0.1 - - [21/Jan/2024:09:03:24 -0300] “GET /server-status HTTP/1.1” 404 196 “-” “csf/”
127.0.0.1 - - [21/Jan/2024:09:03:24 -0300] “GET /server-status HTTP/1.1” 404 196 “-” “curl/7.76.1”
127.0.0.1 - - [21/Jan/2024:22:23:52 -0300] “GET /server-status HTTP/1.1” 404 196 “-” “csf/”
127.0.0.1 - - [21/Jan/2024:22:23:52 -0300] “GET /server-status HTTP/1.1” 404 196 “-” “curl/7.76.1”
127.0.0.1 - - [22/Jan/2024:02:56:02 -0300] “GET /server-status HTTP/1.1” 404 196 “-” “csf/”
127.0.0.1 - - [22/Jan/2024:02:56:23 -0300] “GET /server-status HTTP/1.1” 404 196 “-” “curl/7.76.1”

Those are the times where Load was high.

tail -f /var/log/httpd/error_log

[Sun Jan 21 00:00:06.021165 2024] [core:notice] [pid 1013:tid 1013] AH00094: Command line: ‘/usr/sbin/httpd -D FOREGROUND’
[Sun Jan 21 00:00:06.021176 2024] [mpm_event:notice] [pid 1013:tid 1013] AH00493: SIGUSR1 received. Doing graceful restart
[Sun Jan 21 00:00:06.162956 2024] [lbmethod_heartbeat:notice] [pid 1013:tid 1013] AH02282: No slotmem from mod_heartmonitor
[Sun Jan 21 00:00:06.173930 2024] [mpm_event:notice] [pid 1013:tid 1013] AH00489: Apache/2.4.57 (AlmaLinux) OpenSSL/3.0.7 mod_fcgid/2.3.9 configured – resuming normal operations
[Sun Jan 21 00:00:06.173978 2024] [core:notice] [pid 1013:tid 1013] AH00094: Command line: ‘/usr/sbin/httpd -D FOREGROUND’
[Sun Jan 21 10:43:07.663637 2024] [mpm_event:error] [pid 1013:tid 1013] AH00484: server reached MaxRequestWorkers setting, consider raising the MaxRequestWorkers setting
[Mon Jan 22 07:03:17.510123 2024] [suexec:notice] [pid 953:tid 953] AH01232: suEXEC mechanism enabled (wrapper: /usr/sbin/suexec)
[Mon Jan 22 07:03:17.721398 2024] [lbmethod_heartbeat:notice] [pid 953:tid 953] AH02282: No slotmem from mod_heartmonitor
[Mon Jan 22 07:03:17.732342 2024] [mpm_event:notice] [pid 953:tid 953] AH00489: Apache/2.4.57 (AlmaLinux) OpenSSL/3.0.7 mod_fcgid/2.3.9 configured – resuming normal operations
[Mon Jan 22 07:03:17.732361 2024] [core:notice] [pid 953:tid 953] AH00094: Command line: ‘/usr/sbin/httpd -D FOREGROUND’

Sun Jan 21 10:43:07.663637 2024] [mpm_event:error] [pid 1013:tid 1013] AH00484: server reached MaxRequestWorkers setting, consider raising the MaxRequestWorkers setting

It is difficult to me to get what is cause and what is consequence
Thanks

After taking a quick look at the logs I did a quick search and came up with these links that might be of interest.

Possible brute force from this address?
www.abuseipdb.com/check/213.230.65.53

doc.dovecot.org/admin_manual/system_users_used_by_dovecot/

1 Like

No problem to deny that IP address.
During the day it was calm.
Not sure if useful I am writing a script to get cpu % of top services when Load is high.

#!/bin/sh
 while :
        do
             top -n1 -b | head -15
             echo "---------------------"
               sleep 60s
        done >> /root/topFile

It is running in a screen window
Thanks a lot

DROP is useful in the firewall for known bad actors. The attacker doesn’t know the connection is dropped so they don’t immediate retry. Supposedly that slows down the process.

I’m thinking one weakness in the firewall strategy in general is that repeated failed connections don’t go into the drop list. Postfix and Dovecot can end up rejecting a lot of attempts that never make it to the auth stage where the firewall picks them up. You might want to look into DDOS and DOS mitigation techniques. I know my home router firewall has a button to click but I have no idea what it does under the hood. I haven’t used CSF in over a decade so I don’t know if they offer it as a default.

But, this is a problem when you have no firewall ahead of the server. Your server is still processes the requests so you can’t truly mitigate a DDOS/DOS attack. :frowning:

1 Like

This is a 7 years old thread: CSF should never "DROP" outbound connections - ConfigServer Community Forum

Today morning. Recorded top time intervals longer than 60 secs because of extremely high Load

top - 07:53:21 up 1 day,  3:50,  0 users,  load average: 4.53, 2.06, 1.04
Tasks: 269 total,   2 running, 267 sleeping,   0 stopped,   0 zombie
%Cpu(s):  1.4 us,  5.8 sy,  0.0 ni, 78.3 id,  0.0 wa,  0.0 hi,  0.0 si, 14.5 st
MiB Mem :   7673.4 total,   3900.1 free,   2751.6 used,   1538.3 buff/cache
MiB Swap:    512.0 total,    464.5 free,     47.5 used.   4921.8 avail Mem 

    PID USER      PR  NI    VIRT    RES    SHR S  %CPU  %MEM     TIME+ COMMAND
 292099 root      20   0   10708   4204   3388 R   5.3   0.1   0:00.03 top
      1 root      20   0  170756  14824   9912 S   0.0   0.2   2:51.91 systemd
      2 root      20   0       0      0      0 S   0.0   0.0   0:00.17 kthreadd
      3 root       0 -20       0      0      0 I   0.0   0.0   0:00.00 rcu_gp
      4 root       0 -20       0      0      0 I   0.0   0.0   0:00.00 rcu_par_gp
      5 root       0 -20       0      0      0 I   0.0   0.0   0:00.00 slub_flushwq
      6 root       0 -20       0      0      0 I   0.0   0.0   0:00.00 netns
     10 root       0 -20       0      0      0 I   0.0   0.0   0:00.00 mm_percpu_wq
---------------------
top - 07:54:35 up 1 day,  3:51,  0 users,  load average: 22.22, 7.07, 2.81
Tasks: 274 total,   7 running, 267 sleeping,   0 stopped,   0 zombie
%Cpu(s): 14.7 us, 20.0 sy,  0.0 ni, 38.7 id,  4.0 wa,  0.0 hi,  2.7 si, 20.0 st
MiB Mem :   7673.4 total,   3876.4 free,   2773.9 used,   1540.2 buff/cache
MiB Swap:    512.0 total,    464.5 free,     47.5 used.   4899.5 avail Mem 

    PID USER      PR  NI    VIRT    RES    SHR S  %CPU  %MEM     TIME+ COMMAND
   1835 apache    20   0 2593324  98604  10468 S  91.9   1.3   8:25.61 httpd
    751 root      20   0 1585076  73580  51916 S  79.5   0.9  10:13.25 fail2ban-server
 290251 root      20   0       0      0      0 D  69.6   0.0   0:10.05 kworker/u8:1+flush-8:0
 292184 root      20   0   10140   3508   3156 R   2.5   0.0   0:00.72 ps
 126594 apache    20   0 2593540  88752  10484 S   1.1   1.1   6:19.45 httpd
    606 root      20   0  257216  20492  15908 S   0.7   0.3   0:22.30 NetworkManager
   1090 apache    20   0 2592800  81108  10464 S   0.7   1.0   7:52.78 httpd
     37 root      20   0       0      0      0 S   0.4   0.0   2:38.88 ksoftirqd/3
---------------------
top - 07:56:23 up 1 day,  3:53,  0 users,  load average: 100.04, 35.43, 13.24
Tasks: 294 total,  45 running, 249 sleeping,   0 stopped,   0 zombie
%Cpu(s):  5.3 us, 21.6 sy,  0.0 ni,  0.0 id,  0.0 wa,  0.0 hi,  3.2 si, 70.0 st
MiB Mem :   7673.4 total,   3829.0 free,   2819.0 used,   1543.5 buff/cache
MiB Swap:    512.0 total,    464.5 free,     47.5 used.   4854.3 avail Mem 

    PID USER      PR  NI    VIRT    RES    SHR S  %CPU  %MEM     TIME+ COMMAND
 292282 root      20   0    5836    696    604 R  27.3   0.0   0:03.81 gawk
 216105 user0     20   0  243076  46364  23924 R  18.5   0.6   1:02.84 php-fpm
 292277 user1     20   0   34712   9224   7588 R  13.7   0.1   0:03.75 flatpak
 292221 postfix   20   0   45392   9444   8408 R  12.8   0.1   0:02.63 trivial-rewrite
 292284 root      20   0  229116  14972   6380 R  12.2   0.2   0:01.23 php-fpm
   1431 root      20   0   38172   4112   3976 R  12.1   0.1   0:07.95 master
 292196 root      20   0   43632  31128   3308 R   4.2   0.4   0:05.97 lfd - (child) c
     31 root      20   0       0      0      0 R   3.4   0.0   0:16.93 ksoftirqd/2
---------------------
top - 08:01:34 up 1 day,  3:58,  0 users,  load average: 184.06, 125.89, 58.47
Tasks: 302 total,  50 running, 252 sleeping,   0 stopped,   0 zombie
%Cpu(s):  0.3 us,  0.6 sy,  0.0 ni,  0.0 id,  0.0 wa,  0.0 hi,  0.2 si, 98.9 st
MiB Mem :   7673.4 total,   3813.1 free,   2834.9 used,   1543.4 buff/cache
MiB Swap:    512.0 total,    464.5 free,     47.5 used.   4838.5 avail Mem 

    PID USER      PR  NI    VIRT    RES    SHR S  %CPU  %MEM     TIME+ COMMAND
    495 root      20   0   43424  21308  19560 R   9.2   0.3   2:15.43 systemd-journal
    912 mysql     20   0 2626760 452308  22160 R   6.7   5.8  39:49.94 mariadbd
      1 root      20   0  171012  14824   9912 R   6.5   0.2   3:49.93 systemd
    751 root      20   0 1585076  73580  51916 R   5.3   0.9  11:09.80 fail2ban-server
 292301 root      20   0   10704   4188   3380 R   3.5   0.1   0:20.58 top
    606 root      20   0  257216  20492  15908 R   3.4   0.3   0:34.60 NetworkManager
 290428 root      20   0       0      0      0 R   3.3   0.0   0:35.70 kworker/3:0+events_powe+
 292335 root      20   0   16232   4508   2884 S   3.3   0.1   0:05.78 crond
---------------------
top - 08:12:21 up 1 day,  4:09,  0 users,  load average: 81.45, 116.20, 93.58
Tasks: 308 total,  25 running, 281 sleeping,   0 stopped,   2 zombie
%Cpu(s): 17.9 us, 33.0 sy,  0.0 ni,  0.0 id, 12.3 wa,  0.0 hi,  1.9 si, 34.9 st
MiB Mem :   7673.4 total,   5042.1 free,   2675.2 used,    417.4 buff/cache
MiB Swap:    512.0 total,    464.5 free,     47.5 used.   4998.2 avail Mem 

    PID USER      PR  NI    VIRT    RES    SHR S  %CPU  %MEM     TIME+ COMMAND
 215455 user0     20   0  248536  51664  23592 R 100.0   0.7   1:59.26 php-fpm
 292469 root      20   0       0      0      0 R 100.0   0.0   0:05.63 grep
    626 root      20   0   79192   2924   2684 R 108.4   0.0   0:32.01 irqbalance
 292468 root      20   0       0      0      0 R  97.7   0.0   0:03.96 grep
 216105 user0     20   0  242864  46428  24012 D  77.2   0.6   1:05.91 php-fpm
 292376 root      20   0   10708   4196   3384 R  62.0   0.1   0:26.33 top
 292420 root      20   0   10704   4200   3388 R  31.4   0.1   0:05.63 top
 292288 user0   20   0  229252  23864  15000 R  23.3   0.3   0:06.29 php-fpm
---------------------
top - 08:13:42 up 1 day,  4:10,  0 users,  load average: 80.94, 108.17, 92.51
Tasks: 305 total,   8 running, 297 sleeping,   0 stopped,   0 zombie
%Cpu(s): 57.6 us, 31.8 sy,  0.0 ni,  0.0 id,  0.0 wa,  0.0 hi,  0.0 si, 10.6 st
MiB Mem :   7673.4 total,   4433.6 free,   2872.1 used,    841.9 buff/cache
MiB Swap:    512.0 total,    464.5 free,     47.5 used.   4801.3 avail Mem 

    PID USER      PR  NI    VIRT    RES    SHR S  %CPU  %MEM     TIME+ COMMAND
 292582 root      20   0    9992   2148   1700 R  65.0   0.0   0:01.91 md5sum
 292913 user2  20   0   68472  62920  10868 R  60.0   0.8   0:00.94 spamassassin
 292873 user2  20   0   84068  78572  10876 R  55.0   1.0   0:01.87 spamassassin
 292024 root      20   0       0      0      0 R  15.0   0.0   0:58.19 /usr/libexec/we
      1 root      20   0  170756  14824   9912 S  10.0   0.2   5:01.93 systemd
   2645 root      20   0 2063632 127676   5804 S   5.0   1.6  46:42.47 searchd
 292559 root      20   0  127680 118328   7968 S   5.0   1.5   0:01.51 /usr/libexec/we
 292600 root      20   0   18768   9312   8004 S   5.0   0.1   0:00.07 systemd-logind
---------------------
top - 08:14:42 up 1 day,  4:11,  0 users,  load average: 30.26, 88.67, 86.79
Tasks: 280 total,   2 running, 278 sleeping,   0 stopped,   0 zombie
%Cpu(s):  1.1 us,  4.3 sy,  0.0 ni, 84.8 id,  0.0 wa,  0.0 hi,  0.0 si,  9.8 st
MiB Mem :   7673.4 total,   4842.9 free,   2410.0 used,    897.1 buff/cache
MiB Swap:    512.0 total,    464.5 free,     47.5 used.   5263.4 avail Mem 

    PID USER      PR  NI    VIRT    RES    SHR S  %CPU  %MEM     TIME+ COMMAND
    751 root      20   0 1585076  75576  53904 S   5.6   1.0  13:23.12 fail2ban-server
   2645 root      20   0 2063632 127676   5804 S   5.6   1.6  46:44.01 searchd
 293444 root      20   0   10708   4192   3376 R   5.6   0.1   0:00.03 top
      1 root      20   0  170756  14824   9912 S   0.0   0.2   5:02.24 systemd
      2 root      20   0       0      0      0 S   0.0   0.0   0:00.18 kthreadd
      3 root       0 -20       0      0      0 I   0.0   0.0   0:00.00 rcu_gp
      4 root       0 -20       0      0      0 I   0.0   0.0   0:00.00 rcu_par_gp
      5 root       0 -20       0      0      0 I   0.0   0.0   0:00.00 slub_flushwq
---------------------
top - 08:15:42 up 1 day,  4:12,  0 users,  load average: 11.26, 72.58, 81.37
Tasks: 276 total,   1 running, 275 sleeping,   0 stopped,   0 zombie
%Cpu(s):  0.0 us,  2.7 sy,  0.0 ni, 90.5 id,  0.0 wa,  0.0 hi,  0.0 si,  6.8 st
MiB Mem :   7673.4 total,   4742.5 free,   2413.9 used,    994.7 buff/cache
MiB Swap:    512.0 total,    464.5 free,     47.5 used.   5259.5 avail Mem 

    PID USER      PR  NI    VIRT    RES    SHR S  %CPU  %MEM     TIME+ COMMAND
   2645 root      20   0 2063632 127676   5804 S   6.2   1.6  46:45.63 searchd
 293673 root      20   0   10704   4096   3368 R   6.2   0.1   0:00.03 top
      1 root      20   0  170756  14824   9912 S   0.0   0.2   5:02.36 systemd
      2 root      20   0       0      0      0 S   0.0   0.0   0:00.18 kthreadd
      3 root       0 -20       0      0      0 I   0.0   0.0   0:00.00 rcu_gp
      4 root       0 -20       0      0      0 I   0.0   0.0   0:00.00 rcu_par_gp
      5 root       0 -20       0      0      0 I   0.0   0.0   0:00.00 slub_flushwq
      6 root       0 -20       0      0      0 I   0.0   0.0   0:00.00 netns
---------------------
top - 08:16:42 up 1 day,  4:13,  0 users,  load average: 4.35, 59.43, 76.29
Tasks: 272 total,   1 running, 271 sleeping,   0 stopped,   0 zombie
%Cpu(s):  1.1 us,  3.2 sy,  0.0 ni, 84.0 id,  0.0 wa,  0.0 hi,  0.0 si, 11.7 st
MiB Mem :   7673.4 total,   4696.2 free,   2437.2 used,   1019.0 buff/cache
MiB Swap:    512.0 total,    464.5 free,     47.5 used.   5236.1 avail Mem 

    PID USER      PR  NI    VIRT    RES    SHR S  %CPU  %MEM     TIME+ COMMAND
 293762 root      20   0   10704   4108   3376 R  11.1   0.1   0:00.04 top
    751 root      20   0 1585076  75576  53904 S   5.6   1.0  13:23.93 fail2ban-server
      1 root      20   0  170756  14824   9912 S   0.0   0.2   5:02.41 systemd
      2 root      20   0       0      0      0 S   0.0   0.0   0:00.18 kthreadd
      3 root       0 -20       0      0      0 I   0.0   0.0   0:00.00 rcu_gp
      4 root       0 -20       0      0      0 I   0.0   0.0   0:00.00 rcu_par_gp
      5 root       0 -20       0      0      0 I   0.0   0.0   0:00.00 slub_flushwq
      6 root       0 -20       0      0      0 I   0.0   0.0   0:00.00 netns
---------------------
top - 08:17:43 up 1 day,  4:14,  0 users,  load average: 1.59, 48.61, 71.52
Tasks: 268 total,   1 running, 267 sleeping,   0 stopped,   0 zombie
%Cpu(s):  0.8 us,  1.6 sy,  0.0 ni, 74.0 id,  0.0 wa,  0.0 hi,  0.0 si, 23.6 st
MiB Mem :   7673.4 total,   4663.6 free,   2445.4 used,   1045.4 buff/cache
MiB Swap:    512.0 total,    464.5 free,     47.5 used.   5228.0 avail Mem 

    PID USER      PR  NI    VIRT    RES    SHR S  %CPU  %MEM     TIME+ COMMAND
 293821 root      20   0   10704   4184   3372 R  11.8   0.1   0:00.03 top
      1 root      20   0  170756  14824   9912 S   0.0   0.2   5:02.45 systemd
      2 root      20   0       0      0      0 S   0.0   0.0   0:00.18 kthreadd
      3 root       0 -20       0      0      0 I   0.0   0.0   0:00.00 rcu_gp
      4 root       0 -20       0      0      0 I   0.0   0.0   0:00.00 rcu_par_gp
      5 root       0 -20       0      0      0 I   0.0   0.0   0:00.00 slub_flushwq
      6 root       0 -20       0      0      0 I   0.0   0.0   0:00.00 netns
     10 root       0 -20       0      0      0 I   0.0   0.0   0:00.00 mm_percpu_wq
---------------------
top - 08:18:43 up 1 day,  4:15,  0 users,  load average: 1.09, 39.25, 66.73
Tasks: 269 total,   1 running, 268 sleeping,   0 stopped,   0 zombie
%Cpu(s):  3.8 us,  6.3 sy,  0.0 ni, 79.7 id,  0.0 wa,  0.0 hi,  0.0 si, 10.1 st
MiB Mem :   7673.4 total,   4634.4 free,   2463.8 used,   1056.6 buff/cache
MiB Swap:    512.0 total,    464.5 free,     47.5 used.   5209.6 avail Mem 

    PID USER      PR  NI    VIRT    RES    SHR S  %CPU  %MEM     TIME+ COMMAND
 294164 user0   20   0   15640   8408   6904 S  11.8   0.1   0:00.02 pop3
 293904 root      20   0   16072   9800   8204 S   5.9   0.1   0:00.03 auth
 294162 root      20   0   10704   4108   3376 R   5.9   0.1   0:00.02 top
      1 root      20   0  170756  14824   9912 S   0.0   0.2   5:02.79 systemd
      2 root      20   0       0      0      0 S   0.0   0.0   0:00.18 kthreadd
      3 root       0 -20       0      0      0 I   0.0   0.0   0:00.00 rcu_gp
      4 root       0 -20       0      0      0 I   0.0   0.0   0:00.00 rcu_par_gp
      5 root       0 -20       0      0      0 I   0.0   0.0   0:00.00 slub_flushwq
---------------------
top - 08:19:43 up 1 day,  4:16,  0 users,  load average: 0.58, 32.15, 62.57
Tasks: 260 total,   1 running, 259 sleeping,   0 stopped,   0 zombie
%Cpu(s):  0.0 us,  3.6 sy,  0.0 ni, 86.7 id,  0.0 wa,  0.0 hi,  0.0 si,  9.6 st
MiB Mem :   7673.4 total,   4629.7 free,   2454.5 used,   1071.7 buff/cache
MiB Swap:    512.0 total,    464.5 free,     47.5 used.   5218.9 avail Mem 

    PID USER      PR  NI    VIRT    RES    SHR S  %CPU  %MEM     TIME+ COMMAND
   2645 root      20   0 2063632 127676   5804 S   5.9   1.6  46:51.85 searchd
 294234 root      20   0   10732   4096   3376 R   5.9   0.1   0:00.03 top
      1 root      20   0  170756  14824   9912 S   0.0   0.2   5:02.87 systemd
      2 root      20   0       0      0      0 S   0.0   0.0   0:00.18 kthreadd
      3 root       0 -20       0      0      0 I   0.0   0.0   0:00.00 rcu_gp
      4 root       0 -20       0      0      0 I   0.0   0.0   0:00.00 rcu_par_gp
      5 root       0 -20       0      0      0 I   0.0   0.0   0:00.00 slub_flushwq
      6 root       0 -20       0      0      0 I   0.0   0.0   0:00.00 netns
---------------------
top - 08:20:43 up 1 day,  4:17,  0 users,  load average: 0.31, 26.33, 58.66
Tasks: 269 total,   1 running, 268 sleeping,   0 stopped,   0 zombie
%Cpu(s):  0.0 us,  2.6 sy,  0.0 ni, 88.2 id,  0.0 wa,  0.0 hi,  0.0 si,  9.2 st
MiB Mem :   7673.4 total,   4612.2 free,   2464.6 used,   1079.4 buff/cache
MiB Swap:    512.0 total,    464.5 free,     47.5 used.   5208.8 avail Mem 

    PID USER      PR  NI    VIRT    RES    SHR S  %CPU  %MEM     TIME+ COMMAND
 294427 root      20   0   10704   4116   3388 R   5.9   0.1   0:00.02 top
      1 root      20   0  170756  14824   9912 S   0.0   0.2   5:03.03 systemd
      2 root      20   0       0      0      0 S   0.0   0.0   0:00.18 kthreadd
      3 root       0 -20       0      0      0 I   0.0   0.0   0:00.00 rcu_gp
      4 root       0 -20       0      0      0 I   0.0   0.0   0:00.00 rcu_par_gp
      5 root       0 -20       0      0      0 I   0.0   0.0   0:00.00 slub_flushwq
      6 root       0 -20       0      0      0 I   0.0   0.0   0:00.00 netns
     10 root       0 -20       0      0      0 I   0.0   0.0   0:00.00 mm_percpu_wq
---------------------
top - 08:21:43 up 1 day,  4:18,  0 users,  load average: 0.37, 21.60, 55.01

Doesn’t seem DDoS attack. Most of access requests are from bots

Seems to start with Apache and fail2ban high cpu usage. Does CSF use fail2ban under the hood?

A little searching turns up a command I either wasn’t aware of or had forgotten. ss ss -s is summary. Doing the same thing to get the output when usage goes high might help.

Actually, this might be more useful.
ss -t |grep -v 127

man ss might be worth looking at.

1 Like

Does CSF use fail2ban under the hood?

Almost sure it doesn’t.
I let it running from the beginning a year ago.
I also checked cron jobs ( they also keep unchanged) but the times they run don’t match with incidents.
I haven’t make system/apps changes, only updates from Webmin.
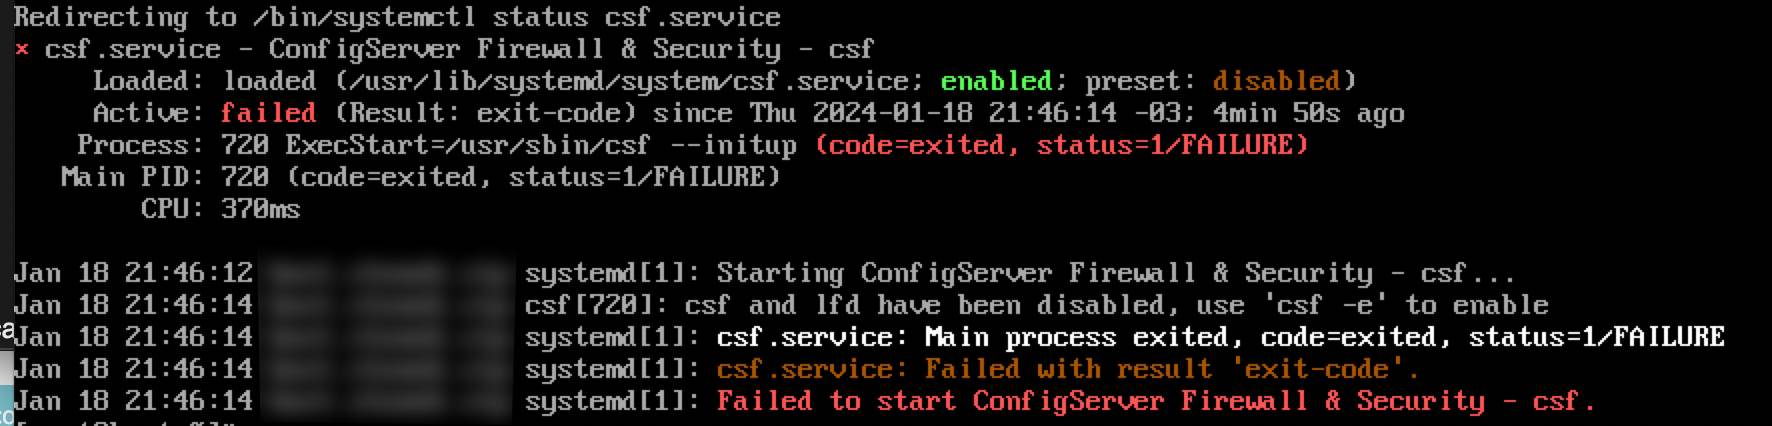
BTW I had another one some minutes ago. I’ll let fail2ban off to check.

top - 17:16:24 up 1 day, 13:13,  1 user,  load average: 0.16, 0.30, 0.33
Tasks: 279 total,   1 running, 278 sleeping,   0 stopped,   0 zombie
%Cpu(s):  0.0 us,  3.0 sy,  0.0 ni, 97.0 id,  0.0 wa,  0.0 hi,  0.0 si,  0.0 st
MiB Mem :   7673.4 total,   4031.7 free,   2854.0 used,   1306.3 buff/cache
MiB Swap:    512.0 total,    464.5 free,     47.5 used.   4819.4 avail Mem 

    PID USER      PR  NI    VIRT    RES    SHR S  %CPU  %MEM     TIME+ COMMAND
 379929 root      20   0   10704   4140   3408 R   6.2   0.1   0:00.02 top
      1 root      20   0  170756  14824   9912 S   0.0   0.2   5:51.29 systemd
      2 root      20   0       0      0      0 S   0.0   0.0   0:00.23 kthreadd
      3 root       0 -20       0      0      0 I   0.0   0.0   0:00.00 rcu_gp
      4 root       0 -20       0      0      0 I   0.0   0.0   0:00.00 rcu_par_gp
      5 root       0 -20       0      0      0 I   0.0   0.0   0:00.00 slub_flushwq
      6 root       0 -20       0      0      0 I   0.0   0.0   0:00.00 netns
     10 root       0 -20       0      0      0 I   0.0   0.0   0:00.00 mm_percpu_wq
---------------------
top - 17:17:25 up 1 day, 13:14,  1 user,  load average: 0.24, 0.29, 0.33
Tasks: 277 total,   1 running, 276 sleeping,   0 stopped,   0 zombie
%Cpu(s):  0.0 us,  4.0 sy,  0.0 ni, 92.0 id,  0.0 wa,  0.0 hi,  0.0 si,  4.0 st
MiB Mem :   7673.4 total,   4029.6 free,   2843.6 used,   1319.5 buff/cache
MiB Swap:    512.0 total,    464.5 free,     47.5 used.   4829.8 avail Mem 

    PID USER      PR  NI    VIRT    RES    SHR S  %CPU  %MEM     TIME+ COMMAND
 380007 root      20   0   10704   4108   3380 R   5.9   0.1   0:00.03 top
      1 root      20   0  170756  14824   9912 S   0.0   0.2   5:51.31 systemd
      2 root      20   0       0      0      0 S   0.0   0.0   0:00.23 kthreadd
      3 root       0 -20       0      0      0 I   0.0   0.0   0:00.00 rcu_gp
      4 root       0 -20       0      0      0 I   0.0   0.0   0:00.00 rcu_par_gp
      5 root       0 -20       0      0      0 I   0.0   0.0   0:00.00 slub_flushwq
      6 root       0 -20       0      0      0 I   0.0   0.0   0:00.00 netns
     10 root       0 -20       0      0      0 I   0.0   0.0   0:00.00 mm_percpu_wq
---------------------
top - 17:18:25 up 1 day, 13:15,  1 user,  load average: 1.31, 0.54, 0.41
Tasks: 283 total,   3 running, 280 sleeping,   0 stopped,   0 zombie
%Cpu(s): 14.6 us, 12.4 sy,  0.0 ni, 41.6 id,  2.2 wa,  0.0 hi,  1.1 si, 28.1 st
MiB Mem :   7673.4 total,   3867.9 free,   2991.1 used,   1335.1 buff/cache
MiB Swap:    512.0 total,    464.5 free,     47.5 used.   4682.3 avail Mem 

    PID USER      PR  NI    VIRT    RES    SHR S  %CPU  %MEM     TIME+ COMMAND
    912 mysql     20   0 2624960 461280  22332 S  18.8   5.9  50:34.04 mariadbd
 380309 root      20   0    9680   7024   5504 R  18.8   0.1   0:00.03 openssl
   1089 apache    20   0 2724724  91924  10460 S  12.5   1.2  11:42.95 httpd
   1090 apache    20   0 2592800  80432  10464 S  12.5   1.0   9:36.72 httpd
 380088 root      20   0  167684 154600   7108 R  12.5   2.0   0:01.85 /usr/libexec/we
   2645 root      20   0 2063632 136336   6644 S   6.2   1.7  60:08.42 searchd
 212721 apache    20   0 2593560  74696  10488 S   6.2   1.0   5:44.21 httpd
 292406 user0   20   0  242440  46372  24276 S   6.2   0.6   0:51.45 php-fpm
---------------------
top - 17:19:25 up 1 day, 13:16,  1 user,  load average: 0.62, 0.47, 0.39
Tasks: 277 total,   1 running, 276 sleeping,   0 stopped,   0 zombie
%Cpu(s):  1.2 us,  3.7 sy,  0.0 ni, 87.8 id,  0.0 wa,  0.0 hi,  0.0 si,  7.3 st
MiB Mem :   7673.4 total,   4035.3 free,   2812.5 used,   1347.0 buff/cache
MiB Swap:    512.0 total,    464.5 free,     47.5 used.   4860.9 avail Mem 

    PID USER      PR  NI    VIRT    RES    SHR S  %CPU  %MEM     TIME+ COMMAND
    769 root      20   0  249736  15132  13172 S   5.9   0.2   1:04.08 rsyslogd
   2645 root      20   0 2063632 136336   6644 S   5.9   1.7  60:10.01 searchd
 292399 apache    20   0 2594072  57704  10972 S   5.9   0.7   2:13.18 httpd
 297944 user3     20   0   16380   8988   7080 S   5.9   0.1   0:00.73 imap
 380419 root      20   0   10704   4204   3388 R   5.9   0.1   0:00.02 top
      1 root      20   0  170756  14824   9912 S   0.0   0.2   5:51.72 systemd
      2 root      20   0       0      0      0 S   0.0   0.0   0:00.23 kthreadd
      3 root       0 -20       0      0      0 I   0.0   0.0   0:00.00 rcu_gp
---------------------
top - 17:20:25 up 1 day, 13:17,  1 user,  load average: 13.51, 3.85, 1.54
Tasks: 284 total,   5 running, 279 sleeping,   0 stopped,   0 zombie
%Cpu(s): 10.7 us,  5.4 sy,  0.0 ni, 16.1 id,  0.0 wa,  0.0 hi,  0.0 si, 67.9 st
MiB Mem :   7673.4 total,   3869.6 free,   2975.4 used,   1350.0 buff/cache
MiB Swap:    512.0 total,    464.5 free,     47.5 used.   4697.9 avail Mem 

    PID USER      PR  NI    VIRT    RES    SHR S  %CPU  %MEM     TIME+ COMMAND
 292404 user0   20   0  194404  56844  18812 R  20.0   0.7   0:56.68 php-fpm
 380424 root      20   0  155720 146904   9088 R  15.0   1.9   0:01.93 /usr/libexec/we
 380502 root      20   0   50956  45524   6192 R  15.0   0.6   0:00.65 monitor.pl
 126594 apache    20   0 2593540  91012  10484 S  10.0   1.2   8:55.89 httpd
 380561 root      20   0   10704   4092   3368 R   5.0   0.1   0:00.05 top
      1 root      20   0  170756  14824   9912 S   0.0   0.2   6:04.10 systemd
      2 root      20   0       0      0      0 S   0.0   0.0   0:00.23 kthreadd
      3 root       0 -20       0      0      0 I   0.0   0.0   0:00.00 rcu_gp
---------------------
top - 17:21:26 up 1 day, 13:18,  1 user,  load average: 5.62, 3.33, 1.50
Tasks: 275 total,   2 running, 273 sleeping,   0 stopped,   0 zombie
%Cpu(s):  1.1 us,  3.4 sy,  0.0 ni, 86.2 id,  0.0 wa,  0.0 hi,  0.0 si,  9.2 st
MiB Mem :   7673.4 total,   4068.4 free,   2769.4 used,   1357.8 buff/cache
MiB Swap:    512.0 total,    464.5 free,     47.5 used.   4904.0 avail Mem 

    PID USER      PR  NI    VIRT    RES    SHR S  %CPU  %MEM     TIME+ COMMAND
    751 root      20   0 1732072  84448  62692 S   5.3   1.1  17:02.27 fail2ban-server
 380701 root      20   0   10704   4112   3384 R   5.3   0.1   0:00.03 top
      1 root      20   0  170756  14824   9912 S   0.0   0.2   6:04.14 systemd
      2 root      20   0       0      0      0 S   0.0   0.0   0:00.23 kthreadd
      3 root       0 -20       0      0      0 I   0.0   0.0   0:00.00 rcu_gp
      4 root       0 -20       0      0      0 I   0.0   0.0   0:00.00 rcu_par_gp
      5 root       0 -20       0      0      0 I   0.0   0.0   0:00.00 slub_flushwq
      6 root       0 -20       0      0      0 I   0.0   0.0   0:00.00 netns
---------------------
top - 17:22:26 up 1 day, 13:19,  1 user,  load average: 2.59, 2.89, 1.46
Tasks: 284 total,   1 running, 283 sleeping,   0 stopped,   0 zombie
%Cpu(s):  9.3 us, 12.0 sy,  0.0 ni, 57.3 id,  4.0 wa,  0.0 hi,  0.0 si, 17.3 st
MiB Mem :   7673.4 total,   4002.4 free,   2827.4 used,   1366.2 buff/cache
MiB Swap:    512.0 total,    464.5 free,     47.5 used.   4846.0 avail Mem 

    PID USER      PR  NI    VIRT    RES    SHR S  %CPU  %MEM     TIME+ COMMAND
 380891 root      20   0   42968  30332   3020 S  52.9   0.4   0:00.14 lfd - (child) (
    769 root      20   0  249736  15132  13172 S   5.9   0.2   1:04.16 rsyslogd
   1090 apache    20   0 2592800  80172  10464 S   5.9   1.0   9:37.01 httpd
   2645 root      20   0 2063632 137492   6768 S   5.9   1.7  60:13.01 searchd
 380893 root      20   0   10704   4116   3388 R   5.9   0.1   0:00.03 top
 380895 root      20   0   38148   5544   5116 S   5.9   0.1   0:00.01 sendmail
      1 root      20   0  170756  14824   9912 S   0.0   0.2   6:04.26 systemd
      2 root      20   0       0      0      0 S   0.0   0.0   0:00.23 kthreadd
---------------------
top - 17:23:52 up 1 day, 13:20,  1 user,  load average: 26.05, 8.63, 3.51
Tasks: 293 total,  32 running, 261 sleeping,   0 stopped,   0 zombie
%Cpu(s): 11.2 us, 13.8 sy,  0.0 ni,  0.0 id,  0.4 wa,  0.0 hi,  0.9 si, 73.7 st
MiB Mem :   7673.4 total,   3806.6 free,   3018.6 used,   1371.4 buff/cache
MiB Swap:    512.0 total,    464.5 free,     47.5 used.   4654.8 avail Mem 

    PID USER      PR  NI    VIRT    RES    SHR S  %CPU  %MEM     TIME+ COMMAND
    751 root      20   0 1732072  84448  62692 R 145.8   1.1  17:15.26 fail2ban-server
 380918 root      20   0  106516  93372   4436 R  96.3   1.2   0:05.23 /usr/libexec/we
 380358 root      20   0       0      0      0 R  56.2   0.0   0:08.14 kworker/0:3+events_free+
 380965 root      20   0   42968  30112   2828 R  48.2   0.4   0:09.89 lfd - (child) p
   1067 nobody    20   0   22736  12724  10604 S  36.1   0.2   0:51.44 proftpd
 292399 apache    20   0 2594072  57488  10972 S  33.7   0.7   2:24.19 httpd
   2645 root      20   0 2063632 137492   6768 S  26.2   1.7  60:19.37 searchd
    912 mysql     20   0 2624960 461276  22332 R   0.7   5.9  51:20.81 mariadbd
---------------------
top - 17:25:07 up 1 day, 13:21,  1 user,  load average: 70.70, 25.56, 9.77
Tasks: 306 total,  35 running, 270 sleeping,   0 stopped,   1 zombie
%Cpu(s):  4.5 us, 19.7 sy,  0.0 ni,  0.0 id,  0.0 wa,  0.0 hi, 37.9 si, 37.9 st
MiB Mem :   7673.4 total,   3835.1 free,   2987.3 used,   1375.7 buff/cache
MiB Swap:    512.0 total,    464.5 free,     47.5 used.   4686.1 avail Mem 

    PID USER      PR  NI    VIRT    RES    SHR S  %CPU  %MEM     TIME+ COMMAND
      1 root      20   0  170756  14824   9912 S   0.0   0.2   6:17.76 systemd
      2 root      20   0       0      0      0 S   0.0   0.0   0:00.23 kthreadd
      3 root       0 -20       0      0      0 I   0.0   0.0   0:00.00 rcu_gp
      4 root       0 -20       0      0      0 I   0.0   0.0   0:00.00 rcu_par_gp
      5 root       0 -20       0      0      0 I   0.0   0.0   0:00.00 slub_flushwq
      6 root       0 -20       0      0      0 I   0.0   0.0   0:00.00 netns
     10 root       0 -20       0      0      0 I   0.0   0.0   0:00.00 mm_percpu_wq
     12 root      20   0       0      0      0 I   0.0   0.0   0:00.00 rcu_tasks_kthre
---------------------
top - 17:26:08 up 1 day, 13:22,  1 user,  load average: 29.51, 22.35, 9.68
Tasks: 295 total,   1 running, 294 sleeping,   0 stopped,   0 zombie
%Cpu(s):  1.4 us,  5.4 sy,  0.0 ni, 89.2 id,  0.0 wa,  0.0 hi,  0.0 si,  4.1 st
MiB Mem :   7673.4 total,   3966.3 free,   2848.6 used,   1383.6 buff/cache
MiB Swap:    512.0 total,    464.5 free,     47.5 used.   4824.8 avail Mem 

    PID USER      PR  NI    VIRT    RES    SHR S  %CPU  %MEM     TIME+ COMMAND
 381562 root      20   0   10704   4116   3388 R  11.8   0.1   0:00.03 top
      1 root      20   0  170756  14824   9912 S   0.0   0.2   6:18.08 systemd
      2 root      20   0       0      0      0 S   0.0   0.0   0:00.23 kthreadd
      3 root       0 -20       0      0      0 I   0.0   0.0   0:00.00 rcu_gp
      4 root       0 -20       0      0      0 I   0.0   0.0   0:00.00 rcu_par_gp
      5 root       0 -20       0      0      0 I   0.0   0.0   0:00.00 slub_flushwq
      6 root       0 -20       0      0      0 I   0.0   0.0   0:00.00 netns
     10 root       0 -20       0      0      0 I   0.0   0.0   0:00.00 mm_percpu_wq
---------------------
top - 17:27:08 up 1 day, 13:23,  1 user,  load average: 11.03, 18.33, 9.09
Tasks: 284 total,   1 running, 283 sleeping,   0 stopped,   0 zombie
%Cpu(s):  0.0 us,  6.5 sy,  0.0 ni, 88.3 id,  0.0 wa,  0.0 hi,  1.3 si,  3.9 st
MiB Mem :   7673.4 total,   3999.6 free,   2810.3 used,   1388.8 buff/cache
MiB Swap:    512.0 total,    464.5 free,     47.5 used.   4863.1 avail Mem 

    PID USER      PR  NI    VIRT    RES    SHR S  %CPU  %MEM     TIME+ COMMAND
 381800 root      20   0   10704   4116   3388 R   5.9   0.1   0:00.03 top
      1 root      20   0  170756  14824   9912 S   0.0   0.2   6:18.20 systemd
      2 root      20   0       0      0      0 S   0.0   0.0   0:00.23 kthreadd
      3 root       0 -20       0      0      0 I   0.0   0.0   0:00.00 rcu_gp
      4 root       0 -20       0      0      0 I   0.0   0.0   0:00.00 rcu_par_gp
      5 root       0 -20       0      0      0 I   0.0   0.0   0:00.00 slub_flushwq
      6 root       0 -20       0      0      0 I   0.0   0.0   0:00.00 netns
     10 root       0 -20       0      0      0 I   0.0   0.0   0:00.00 mm_percpu_wq
---------------------
top - 17:28:08 up 1 day, 13:24,  1 user,  load average: 4.19, 15.03, 8.53
Tasks: 295 total,   2 running, 292 sleeping,   0 stopped,   1 zombie
%Cpu(s):  1.4 us,  5.6 sy,  0.0 ni, 91.7 id,  0.0 wa,  0.0 hi,  0.0 si,  1.4 st
MiB Mem :   7673.4 total,   3991.8 free,   2814.9 used,   1392.4 buff/cache
MiB Swap:    512.0 total,    464.5 free,     47.5 used.   4858.5 avail Mem 

    PID USER      PR  NI    VIRT    RES    SHR S  %CPU  %MEM     TIME+ COMMAND
    751 root      20   0 1732072  87140  65384 S   5.9   1.1  17:22.91 fail2ban-server
 382072 root      20   0   10704   4116   3388 R   5.9   0.1   0:00.02 top
 382074 root      20   0   10568   4108   3380 R   5.9   0.1   0:00.01 top
      1 root      20   0  170756  14824   9912 S   0.0   0.2   6:18.38 systemd
      2 root      20   0       0      0      0 S   0.0   0.0   0:00.23 kthreadd
      3 root       0 -20       0      0      0 I   0.0   0.0   0:00.00 rcu_gp
      4 root       0 -20       0      0      0 I   0.0   0.0   0:00.00 rcu_par_gp
      5 root       0 -20       0      0      0 I   0.0   0.0   0:00.00 slub_flushwq
---------------------
top - 17:29:08 up 1 day, 13:25,  1 user,  load average: 1.72, 12.34, 8.01
Tasks: 282 total,   1 running, 281 sleeping,   0 stopped,   0 zombie
%Cpu(s):  1.4 us,  8.1 sy,  0.0 ni, 89.2 id,  0.0 wa,  0.0 hi,  0.0 si,  1.4 st
MiB Mem :   7673.4 total,   3982.7 free,   2821.3 used,   1395.2 buff/cache
MiB Swap:    512.0 total,    464.5 free,     47.5 used.   4852.1 avail Mem 

    PID USER      PR  NI    VIRT    RES    SHR S  %CPU  %MEM     TIME+ COMMAND
 382220 root      20   0   10700   4108   3380 S  11.8   0.1   0:00.02 top
 382218 root      20   0   10704   4108   3384 R   5.9   0.1   0:00.03 top
      1 root      20   0  170756  14824   9912 S   0.0   0.2   6:18.54 systemd
      2 root      20   0       0      0      0 S   0.0   0.0   0:00.23 kthreadd
      3 root       0 -20       0      0      0 I   0.0   0.0   0:00.00 rcu_gp
      4 root       0 -20       0      0      0 I   0.0   0.0   0:00.00 rcu_par_gp
      5 root       0 -20       0      0      0 I   0.0   0.0   0:00.00 slub_flushwq
      6 root       0 -20       0      0      0 I   0.0   0.0   0:00.00 netns
---------------------
top - 17:30:09 up 1 day, 13:26,  1 user,  load average: 0.82, 10.14, 7.52
Tasks: 277 total,   1 running, 276 sleeping,   0 stopped,   0 zombie
%Cpu(s):  2.1 us,  5.2 sy,  0.0 ni, 78.1 id,  0.0 wa,  0.0 hi,  1.0 si, 13.5 st
MiB Mem :   7673.4 total,   4002.7 free,   2797.9 used,   1398.8 buff/cache
MiB Swap:    512.0 total,    464.5 free,     47.5 used.   4875.5 avail Mem 

    PID USER      PR  NI    VIRT    RES    SHR S  %CPU  %MEM     TIME+ COMMAND
   2645 root      20   0 2063632 137492   6768 S  10.0   1.7  60:37.91 searchd
 382320 root      20   0   10704   4116   3388 R   5.0   0.1   0:00.03 top
 382322 root      20   0   10700   4196   3388 S   5.0   0.1   0:00.01 top
      1 root      20   0  170756  14824   9912 S   0.0   0.2   6:18.62 systemd
      2 root      20   0       0      0      0 S   0.0   0.0   0:00.23 kthreadd
      3 root       0 -20       0      0      0 I   0.0   0.0   0:00.00 rcu_gp
      4 root       0 -20       0      0      0 I   0.0   0.0   0:00.00 rcu_par_gp
      5 root       0 -20       0      0      0 I   0.0   0.0   0:00.00 slub_flushwq
---------------------
top - 17:31:09 up 1 day, 13:27,  1 user,  load average: 0.42, 8.32, 7.06
Tasks: 276 total,   1 running, 275 sleeping,   0 stopped,   0 zombie
%Cpu(s):  2.4 us,  6.1 sy,  0.0 ni, 79.3 id,  0.0 wa,  0.0 hi,  0.0 si, 12.2 st
MiB Mem :   7673.4 total,   4005.6 free,   2794.6 used,   1399.1 buff/cache
MiB Swap:    512.0 total,    464.5 free,     47.5 used.   4878.8 avail Mem 

    PID USER      PR  NI    VIRT    RES    SHR S  %CPU  %MEM     TIME+ COMMAND
 382391 root      20   0   10704   4112   3384 R  11.8   0.1   0:00.04 top
 382393 root      20   0   10700   4132   3404 S  11.8   0.1   0:00.02 top
    751 root      20   0 1732072  87140  65384 S   5.9   1.1  17:24.27 fail2ban-server
   2645 root      20   0 2063632 137492   6768 S   5.9   1.7  60:39.25 searchd
 139359 root      20   0    7256   3612   3108 S   5.9   0.0   0:20.04 top_data
      1 root      20   0  170756  14824   9912 S   0.0   0.2   6:18.66 systemd
      2 root      20   0       0      0      0 S   0.0   0.0   0:00.23 kthreadd
      3 root       0 -20       0      0      0 I   0.0   0.0   0:00.00 rcu_gp
---------------------
top - 17:32:09 up 1 day, 13:28,  1 user,  load average: 0.27, 6.83, 6.62
Tasks: 286 total,   1 running, 285 sleeping,   0 stopped,   0 zombie
%Cpu(s):  2.5 us,  5.1 sy,  0.0 ni, 86.1 id,  0.0 wa,  0.0 hi,  0.0 si,  6.3 st
MiB Mem :   7673.4 total,   3984.4 free,   2814.1 used,   1401.1 buff/cache
MiB Swap:    512.0 total,    464.5 free,     47.5 used.   4859.3 avail Mem 

    PID USER      PR  NI    VIRT    RES    SHR S  %CPU  %MEM     TIME+ COMMAND
     17 root      20   0       0      0      0 I   5.6   0.0   3:53.63 rcu_preempt
 382581 root      20   0   10704   4116   3388 R   5.6   0.1   0:00.03 top
 382583 root      20   0   10700   4112   3388 S   5.6   0.1   0:00.01 top
      1 root      20   0  170756  14824   9912 S   0.0   0.2   6:18.79 systemd
      2 root      20   0       0      0      0 S   0.0   0.0   0:00.23 kthreadd
      3 root       0 -20       0      0      0 I   0.0   0.0   0:00.00 rcu_gp
      4 root       0 -20       0      0      0 I   0.0   0.0   0:00.00 rcu_par_gp
      5 root       0 -20       0      0      0 I   0.0   0.0   0:00.00 slub_flushwq
---------------------
top - 17:33:09 up 1 day, 13:29,  1 user,  load average: 0.32, 5.64, 6.22
Tasks: 284 total,   1 running, 283 sleeping,   0 stopped,   0 zombie
%Cpu(s):  2.3 us,  4.7 sy,  0.0 ni, 79.1 id,  0.0 wa,  0.0 hi,  1.2 si, 12.8 st
MiB Mem :   7673.4 total,   3990.9 free,   2805.4 used,   1403.4 buff/cache
MiB Swap:    512.0 total,    464.5 free,     47.5 used.   4868.0 avail Mem 

    PID USER      PR  NI    VIRT    RES    SHR S  %CPU  %MEM     TIME+ COMMAND
 382815 root      20   0   10704   4116   3388 R  11.8   0.1   0:00.04 top
     17 root      20   0       0      0      0 I   5.9   0.0   3:53.73 rcu_preempt
 382817 root      20   0   10700   4112   3388 S   5.9   0.1   0:00.01 top
      1 root      20   0  170756  14824   9912 S   0.0   0.2   6:18.96 systemd
      2 root      20   0       0      0      0 S   0.0   0.0   0:00.23 kthreadd
      3 root       0 -20       0      0      0 I   0.0   0.0   0:00.00 rcu_gp
      4 root       0 -20       0      0      0 I   0.0   0.0   0:00.00 rcu_par_gp
      5 root       0 -20       0      0      0 I   0.0   0.0   0:00.00 slub_flushwq

ss -t |grep -v 127

State      Recv-Q Send-Q         Local Address:Port                   Peer Address:Port         Process
ESTAB      0      0               xxx.xxx.xxx.xxx:imaps                 179.43.189.82:62994               
ESTAB      0      0               xxx.xxx.xxx.xxx:imaps                   179.24.1.92:49156               
ESTAB      0      0               xxx.xxx.xxx.xxx:ndmp                    179.24.1.92:50758               
ESTAB      0      0               xxx.xxx.xxx.xxx:imaps                37.120.246.149:49411               
ESTAB      0      0               xxx.xxx.xxx.xxx:submission            179.43.189.82:52453               
ESTAB      0      0               xxx.xxx.xxx.xxx:imaps                37.120.246.149:49694               
ESTAB      0      0               xxx.xxx.xxx.xxx:imaps                 179.43.189.82:62791               
ESTAB      0      0               xxx.xxx.xxx.xxx:imaps                 179.43.189.82:51822               
ESTAB      0      0               xxx.xxx.xxx.xxx:imaps                37.120.246.149:49704               
ESTAB      0      0               xxx.xxx.xxx.xxx:imaps                 179.43.189.82:57704               
ESTAB      0      116             xxx.xxx.xxx.xxx:ssh-PORT         179.24.1.92:53130               
FIN-WAIT-2 0      0      [::ffff:xxx.xxx.xxx.xxx]:https        [::ffff:200.40.250.38]:52532               
ESTAB      0      0      [::ffff:xxx.xxx.xxx.xxx]:https         [::ffff:167.108.9.35]:27121               
ESTAB      0      0      [::ffff:xxx.xxx.xxx.xxx]:https       [::ffff:181.174.67.145]:17636               
ESTAB      0      0      [::ffff:xxx.xxx.xxx.xxx]:https         [::ffff:167.56.83.22]:48230               
ESTAB      0      574    [::ffff:xxx.xxx.xxx.xxx]:https      [::ffff:114.119.134.110]:36145               
ESTAB      0      0      [::ffff:xxx.xxx.xxx.xxx]:https       [::ffff:52.167.144.145]:facsys-router

I’ll add this in that 60 secs report.
Thank you

This is now. fail2ban not running

top - 18:48:04 up 1 day, 14:44,  1 user,  load average: 8.77, 8.12, 5.89
Tasks: 277 total,  10 running, 267 sleeping,   0 stopped,   0 zombie
%Cpu(s):  2.8 us,  5.6 sy,  0.0 ni, 88.9 id,  0.0 wa,  0.0 hi,  0.0 si,  2.8 st
MiB Mem :   7673.4 total,   4074.3 free,   2725.2 used,   1402.5 buff/cache
MiB Swap:    512.0 total,    464.5 free,     47.5 used.   4948.2 avail Mem 

    PID USER      PR  NI    VIRT    RES    SHR S  %CPU  %MEM     TIME+ COMMAND
 395591 root      20   0   10704   4112   3388 R   5.9   0.1   0:00.02 top
      1 root      20   0  170756  14824   9912 S   0.0   0.2   7:08.61 systemd
      2 root      20   0       0      0      0 S   0.0   0.0   0:00.24 kthreadd
      3 root       0 -20       0      0      0 I   0.0   0.0   0:00.00 rcu_gp
      4 root       0 -20       0      0      0 I   0.0   0.0   0:00.00 rcu_par_gp
      5 root       0 -20       0      0      0 I   0.0   0.0   0:00.00 slub_flushwq
      6 root       0 -20       0      0      0 I   0.0   0.0   0:00.00 netns
     10 root       0 -20       0      0      0 I   0.0   0.0   0:00.00 mm_percpu_wq
---------------------
State      Recv-Q Send-Q         Local Address:Port              Peer Address:Port     Process
ESTAB      0      0               x.x.x.x:imaps            179.43.189.82:52661           
ESTAB      0      0               x.x.x.x:imaps              179.24.1.92:49156           
ESTAB      0      0               x.x.x.x:imaps           37.120.246.149:50231           
ESTAB      0      39              x.x.x.x:imaps            179.43.189.82:65370           
ESTAB      0      0               x.x.x.x:imaps           37.120.246.149:50309           
ESTAB      0      0               x.x.x.x:imaps            179.43.189.82:55142           
ESTAB      0      0               x.x.x.x:SSH-port         179.24.1.92:53130           
FIN-WAIT-2 0      0      [::ffff:x.x.x.x]:https   [::ffff:88.168.84.139]:mxxrlogin       
FIN-WAIT-2 0      0      [::ffff:x.x.x.x]:https  [::ffff:186.50.185.122]:60758           
ESTAB      0      530    [::ffff:x.x.x.x]:https [::ffff:213.152.187.215]:35052           
ESTAB      0      0      [::ffff:x.x.x.x]:https  [::ffff:186.50.185.122]:60762           
FIN-WAIT-1 0      22210  [::ffff:x.x.x.x]:https   [::ffff:47.128.38.159]:34538           
FIN-WAIT-1 0      25     [::ffff:x.x.x.x]:https   [::ffff:66.249.64.203]:65465           
ESTAB      0      0      [::ffff:x.x.x.x]:https    [::ffff:40.77.167.22]:61245           
FIN-WAIT-2 0      0      [::ffff:x.x.x.x]:http    [::ffff:65.108.128.54]:57374           
ESTAB      0      4618   [::ffff:x.x.x.x]:https   [::ffff:85.208.96.203]:46146           
FIN-WAIT-1 0      38789  [::ffff:x.x.x.x]:https   [::ffff:65.108.128.54]:19024           
ESTAB      0      0      [::ffff:x.x.x.x]:https [::ffff:190.132.254.192]:12227           
FIN-WAIT-1 0      18711  [::ffff:x.x.x.x]:https  [::ffff:185.191.171.14]:8360            
FIN-WAIT-1 0      18772  [::ffff:x.x.x.x]:https  [::ffff:185.191.171.11]:62380           
ESTAB      0      0      [::ffff:x.x.x.x]:https  [::ffff:52.167.144.212]:62405           
ESTAB      0      0      [::ffff:x.x.x.x]:https  [::ffff:52.167.144.219]:60747           
ESTAB      0      0      [::ffff:x.x.x.x]:https [::ffff:190.132.254.192]:12226

Issue lasted few minutes

top - 18:48:04 up 1 day, 14:44,  1 user,  load average: 8.77, 8.12, 5.89
Tasks: 277 total,  10 running, 267 sleeping,   0 stopped,   0 zombie
%Cpu(s):  2.8 us,  5.6 sy,  0.0 ni, 88.9 id,  0.0 wa,  0.0 hi,  0.0 si,  2.8 st
MiB Mem :   7673.4 total,   4074.3 free,   2725.2 used,   1402.5 buff/cache
MiB Swap:    512.0 total,    464.5 free,     47.5 used.   4948.2 avail Mem 

    PID USER      PR  NI    VIRT    RES    SHR S  %CPU  %MEM     TIME+ COMMAND
 395591 root      20   0   10704   4112   3388 R   5.9   0.1   0:00.02 top
      1 root      20   0  170756  14824   9912 S   0.0   0.2   7:08.61 systemd
      2 root      20   0       0      0      0 S   0.0   0.0   0:00.24 kthreadd
      3 root       0 -20       0      0      0 I   0.0   0.0   0:00.00 rcu_gp
      4 root       0 -20       0      0      0 I   0.0   0.0   0:00.00 rcu_par_gp
      5 root       0 -20       0      0      0 I   0.0   0.0   0:00.00 slub_flushwq
      6 root       0 -20       0      0      0 I   0.0   0.0   0:00.00 netns
     10 root       0 -20       0      0      0 I   0.0   0.0   0:00.00 mm_percpu_wq

top - 07:10:56 up 2 days,  3:07,  1 user,  load average: 8.45, 3.49, 2.60
Tasks: 283 total,   5 running, 278 sleeping,   0 stopped,   0 zombie
%Cpu(s):  1.1 us,  2.1 sy,  0.0 ni, 22.1 id, 61.1 wa,  0.0 hi,  1.1 si, 12.6 st
MiB Mem :   7673.4 total,   4322.7 free,   2769.1 used,   1194.6 buff/cache
MiB Swap:    512.0 total,    468.2 free,     43.8 used.   4904.3 avail Mem 

    PID USER      PR  NI    VIRT    RES    SHR S  %CPU  %MEM     TIME+ COMMAND
 514850 root      20   0   10704   4140   3412 R  17.6   0.1   0:00.04 top
   2645 root      20   0 2066704 146924   6772 S   5.9   1.9  88:17.50 searchd
      1 root      20   0  170756  14880   9912 S   0.0   0.2  14:59.80 systemd
      2 root      20   0       0      0      0 S   0.0   0.0   0:06.77 kthreadd
      3 root       0 -20       0      0      0 I   0.0   0.0   0:00.00 rcu_gp
      4 root       0 -20       0      0      0 I   0.0   0.0   0:00.00 rcu_par_gp
      5 root       0 -20       0      0      0 I   0.0   0.0   0:00.00 slub_flushwq
      6 root       0 -20       0      0      0 I   0.0   0.0   0:00.00 netns

top - 07:12:09 up 2 days,  3:08,  1 user,  load average: 15.33, 6.41, 3.67
Tasks: 282 total,  15 running, 264 sleeping,   0 stopped,   3 zombie
%Cpu(s): 25.7 us, 31.2 sy,  0.0 ni, 18.1 id,  0.0 wa,  0.0 hi,  2.1 si, 22.9 st
MiB Mem :   7673.4 total,   4300.2 free,   2743.4 used,   1241.1 buff/cache
MiB Swap:    512.0 total,    468.5 free,     43.5 used.   4929.9 avail Mem 

    PID USER      PR  NI    VIRT    RES    SHR S  %CPU  %MEM     TIME+ COMMAND
 515042 postfix   20   0   45260   8188   7220 S  54.0   0.1   0:07.44 pickup
 514838 root      20   0       0      0      0 R  45.8   0.0   0:03.51 /usr/libexec/we
   2095 dovecot   20   0   11596   7708   6052 S  45.2   0.1   1:19.40 stats
 515083 root      20   0   46524  35580   7728 R  37.1   0.5   0:01.96 /usr/libexec/we
 514746 root      20   0  181048 172232   9904 R   1.5   2.2   0:03.05 /usr/libexec/we
    495 root      20   0   43424  17364  15608 R   1.3   0.2   7:01.31 systemd-journal
 514796 root      20   0       0      0      0 Z   1.3   0.0   0:13.41 /usr/libexec/we
 514612 root      20   0  143508 134508   8660 D   0.8   1.7   0:01.81 /usr/libexec/we

top - 07:14:33 up 2 days,  3:11,  1 user,  load average: 38.35, 18.33, 8.48
Tasks: 278 total,  34 running, 242 sleeping,   0 stopped,   2 zombie
%Cpu(s):  2.9 us, 12.4 sy,  0.0 ni,  0.0 id,  0.0 wa,  0.0 hi,  1.9 si, 82.8 st
MiB Mem :   7673.4 total,   4494.8 free,   2534.1 used,   1255.8 buff/cache
MiB Swap:    512.0 total,    468.7 free,     43.3 used.   5139.3 avail Mem 

    PID USER      PR  NI    VIRT    RES    SHR S  %CPU  %MEM     TIME+ COMMAND
      1 root      20   0  170756  14880   9912 R  21.5   0.2  15:32.93 systemd
    769 root      20   0  279260  12940  10940 S  14.5   0.2   4:06.38 rsyslogd
 515189 root      20   0   15308   3564   2132 R  12.0   0.0   0:05.21 crond
    495 root      20   0   43424  17364  15608 R  11.8   0.2   7:10.86 systemd-journal
 515065 root      20   0       0      0      0 R   9.2   0.0   0:08.16 kworker/0:1+events_freezable
 515188 root      20   0     424      4      0 R   7.3   0.0   0:03.17 head
 448710 root      20   0  113092 103400  11356 S   7.1   1.3   1:16.45 spamd
 292629 root      20   0  257200  19316  16704 S   6.4   0.2   2:15.08 NetworkManager

top - 07:17:02 up 2 days,  3:13,  1 user,  load average: 44.44, 32.16, 15.30
Tasks: 271 total,   2 running, 269 sleeping,   0 stopped,   0 zombie
%Cpu(s):  7.0 us, 16.3 sy,  0.0 ni, 40.7 id, 17.4 wa,  0.0 hi,  1.2 si, 17.4 st
MiB Mem :   7673.4 total,   4175.7 free,   2765.3 used,   1346.8 buff/cache
MiB Swap:    512.0 total,    468.7 free,     43.3 used.   4908.1 avail Mem 

    PID USER      PR  NI    VIRT    RES    SHR S  %CPU  %MEM     TIME+ COMMAND
     17 root      20   0       0      0      0 I   5.9   0.0   5:41.41 rcu_preempt
   2645 root      20   0 2066704 146924   6772 S   5.9   1.9  88:40.54 searchd
 515298 root      20   0  158164 145096   7116 R   5.9   1.8   0:01.75 /usr/libexec/we
 515538 root      20   0   10704   4116   3384 R   5.9   0.1   0:00.02 top
      1 root      20   0  170756  14880   9912 S   0.0   0.2  16:17.22 systemd
      2 root      20   0       0      0      0 S   0.0   0.0   0:06.77 kthreadd
      3 root       0 -20       0      0      0 I   0.0   0.0   0:00.00 rcu_gp
      4 root       0 -20       0      0      0 I   0.0   0.0   0:00.00 rcu_par_gp

top - 07:18:02 up 2 days,  3:14,  1 user,  load average: 16.68, 26.45, 14.39
Tasks: 260 total,   2 running, 258 sleeping,   0 stopped,   0 zombie
%Cpu(s):  2.7 us, 21.6 sy,  0.0 ni, 66.2 id,  0.0 wa,  0.0 hi,  0.0 si,  9.5 st
MiB Mem :   7673.4 total,   4367.8 free,   2420.1 used,   1508.8 buff/cache
MiB Swap:    512.0 total,    468.7 free,     43.3 used.   5253.2 avail Mem 

    PID USER      PR  NI    VIRT    RES    SHR S  %CPU  %MEM     TIME+ COMMAND
 519261 root      20   0  154760 141676   7064 S  31.2   1.8   0:01.09 /usr/libexec/we
   2645 root      20   0 2066704 146924   6772 S   6.2   1.9  88:41.74 searchd
 519334 root      20   0   10732   4196   3384 R   6.2   0.1   0:00.01 top
      1 root      20   0  170756  14880   9912 S   0.0   0.2  16:17.39 systemd
      2 root      20   0       0      0      0 S   0.0   0.0   0:06.77 kthreadd
      3 root       0 -20       0      0      0 I   0.0   0.0   0:00.00 rcu_gp
      4 root       0 -20       0      0      0 I   0.0   0.0   0:00.00 rcu_par_gp
      5 root       0 -20       0      0      0 I   0.0   0.0   0:00.00 slub_flushwq

top - 07:19:02 up 2 days,  3:15,  1 user,  load average: 6.32, 21.68, 13.50
Tasks: 257 total,   2 running, 255 sleeping,   0 stopped,   0 zombie
%Cpu(s): 22.4 us,  6.0 sy,  0.0 ni, 71.6 id,  0.0 wa,  0.0 hi,  0.0 si,  0.0 st
MiB Mem :   7673.4 total,   4496.2 free,   2291.6 used,   1508.9 buff/cache
MiB Swap:    512.0 total,    468.7 free,     43.3 used.   5381.7 avail Mem 

    PID USER      PR  NI    VIRT    RES    SHR S  %CPU  %MEM     TIME+ COMMAND
 519689 root      20   0   61216  49988   6564 R 100.0   0.6   0:00.22 /usr/libexec/we
   2645 root      20   0 2066704 146924   6772 S   6.2   1.9  88:42.83 searchd
 519749 root      20   0   10728   4116   3392 R   6.2   0.1   0:00.01 top
      1 root      20   0  170756  14880   9912 S   0.0   0.2  16:17.54 systemd
      2 root      20   0       0      0      0 S   0.0   0.0   0:06.77 kthreadd
      3 root       0 -20       0      0      0 I   0.0   0.0   0:00.00 rcu_gp
      4 root       0 -20       0      0      0 I   0.0   0.0   0:00.00 rcu_par_gp
      5 root       0 -20       0      0      0 I   0.0   0.0   0:00.00 slub_flushwq

top - 07:20:03 up 2 days,  3:16,  1 user,  load average: 2.35, 17.75, 12.66
Tasks: 265 total,   1 running, 264 sleeping,   0 stopped,   0 zombie
%Cpu(s):  0.0 us,  2.9 sy,  0.0 ni, 95.7 id,  0.0 wa,  0.0 hi,  0.0 si,  1.4 st
MiB Mem :   7673.4 total,   4511.3 free,   2276.4 used,   1509.1 buff/cache
MiB Swap:    512.0 total,    468.7 free,     43.3 used.   5397.0 avail Mem 

    PID USER      PR  NI    VIRT    RES    SHR S  %CPU  %MEM     TIME+ COMMAND
   2645 root      20   0 2066704 146924   6772 S   5.9   1.9  88:44.05 searchd
 519924 root      20   0   10700   4240   3384 R   5.9   0.1   0:00.02 top
      1 root      20   0  170756  14880   9912 S   0.0   0.2  16:17.59 systemd
      2 root      20   0       0      0      0 S   0.0   0.0   0:06.77 kthreadd
      3 root       0 -20       0      0      0 I   0.0   0.0   0:00.00 rcu_gp
      4 root       0 -20       0      0      0 I   0.0   0.0   0:00.00 rcu_par_gp
      5 root       0 -20       0      0      0 I   0.0   0.0   0:00.00 slub_flushwq
      6 root       0 -20       0      0      0 I   0.0   0.0   0:00.00 netns

A look at maillog times around 07:12 does not show nothing relevant, just a couple of this

`Jan 24 07:10:18 host postfix/smtpd[514668]: warning: 5.185.125.17.ipv4.public.orange.pl[5.185.125.17]: SASL LOGIN authentication failed: authentication failure`

and

Jan 24 07:10:49 host dovecot[982]: imap(514009): Warning: Time jumped forwards 14.698225 seconds

Apache logs mostly show known bots like Bing, Amazon, Google…
I don’t know what to do or what extra info to share.
As said, during months I only run updates from Webmin.
In Webmin System Info (Dashboard) CPU also displayed high, same as in stats below.
Could be a network issue?
I know High Load is not the same as high use of CPU but my knlowedge doesn’t go beyond that.

---- Now it goes again.

Message from syslogd@host at Jan 24 11:40:09 ...
kernel:watchdog: BUG: soft lockup - CPU#2 stuck for 45s! [spamassassin:559650]

Webmin Dashboard is held (CPU 2%)

By default auditd is installed. Can I get something useful from its logs? How so?
Writing scripts with custom auditctl command?

I’ve never seen a ‘soft lockup’ before. Is this a virtual server? Is it possible the provider did an update? That said, Spam Assassin would be worth looking at. I had to set the default size of the file to check to around 1 meg because spammers learned the default for SA was 512K and were simply padding out emails over 512K to avoid being checked.