I run into a problem that I never encountered before: on a dedicated server (Debian 10, up to date) hosting multiple websites, the bandwidth monitoring does not seem to work anymore … but just for one single Virtual Server.
Bandwidth Monitoring is on:
System Settings > Bandwidth Monitoring > Period, schedule and email > Bandwidth monitoring active: yes
(I tried to switch it off and on again)
System Settings > Bandwidth Monitoring > Servers and log files > Servers to check: All servers
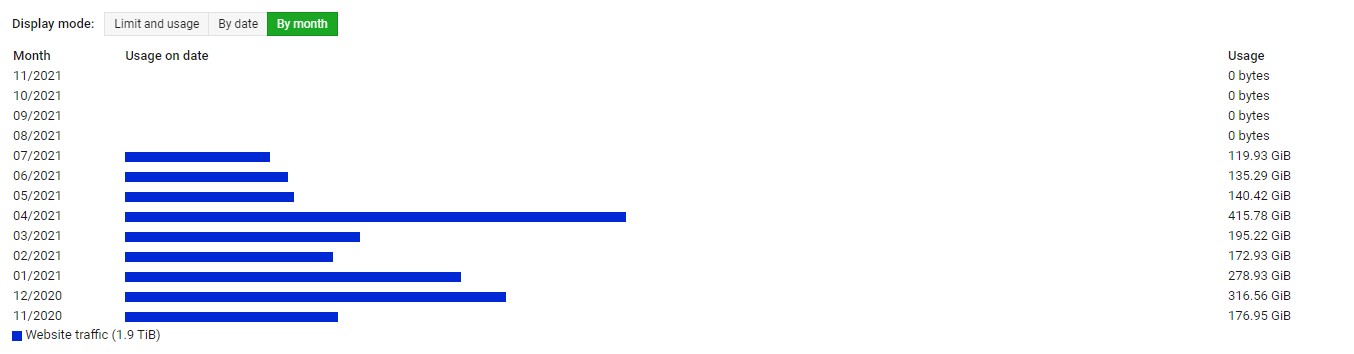
The bandwidth is correctly monitored for all Virtual Servers except for one where it looks like this:
Obviously, it stopped working at some point in July … and this corresponds to the moment when the site has been transferred from an previous server to the current one.
The Apache log files for this Virtual Server look good (good permissions, ownerships, correctly rotated).
bw.pl seems to be correctly configured to run “Every hour at 0 past the hour” in the “Webmin Scheduled Functions”.
I tried to run /etc/webmin/virtual-server/bw.pl manualy: it returns no errors (actually it returns nothing).
Also note that the AWstats Report shows the expected bandwidth usage for this very Virtual Server.
Same here, just discovered that on at least one server the bandwidth monitoring for at least one or two virtual webservers just stopped one or two months ago.
I’m a bit stumped as to where to start looking for a reason, too.
I have no idea of what’s is happening on cmeis’ server (thank you by the way @cmeis for bumping this topic, I also haven’t fixed this issue yet), but at least in my case it completely stopped counting…
If they’re not set like this, the monitoring will automatically shut off if you ever hit your limit and will stay off if they fall below the limit unless it’s set to turn back on. The big numbers you’re running that may have happened.
Thanks for your help @Gomez_Adams, but these settings do not apply in my case since the bandwidth is not limited. I actually never limit it, on no Virtual Server, I only monitor the bandwidth for billing purposes.
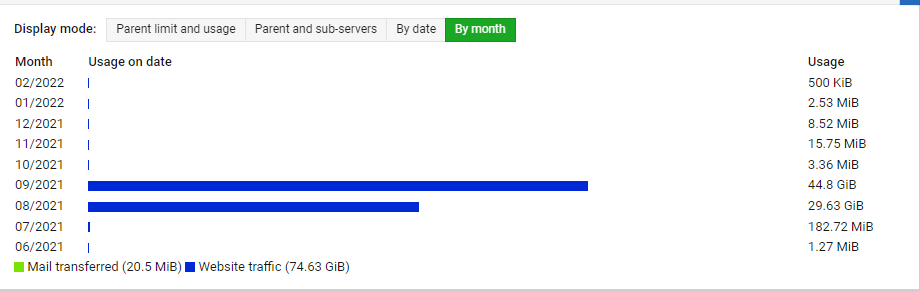
Thanks for chiming in. Actually, traffic like the 44 GB is more like normal traffic.
And yes, bandwidth did not “stop” actually, but the reported bandwidth usage is nowhere nearly realistic, and looking at the access_log I KNOW that there’s a lot more traffic than reported by bandwidth monitoring.
For example the bandwidth report for this one virtual server is showing 250.86 KiB for January (so roughly 4 days), but analysing the access_log is showing a real bandwith usage of neary 6 GiB!
So obviously something is wrong, looking at the wrong log files or the like?
@Nico94@cmeis When did you start seeing this issue? After migration and/or virtual servers restore?
I think simple toggling of Bandwidth monitoring active option on System Settings ⇾ Bandwidth Monitoring page, by first disabling and saving and then re-enabling and saving would solve this problem?
It will regenerate related config options and most importantly will re-create possibly missing cron job under Webmin ⇾ Webmin Configuration: Webmin Scheduled Functions, which should be found there as bw.pl in Parameters column. Do you have it there at the moment by the way?
I think the problem mainly exists for servers that had been transferred from other VirtualMin installations, but it’s spreading over too much time now to say for sure.
Disabling bandwidth monitoring system-wide and re-enabling it didn’t help at first sight (yes, I manually ran the bw.pl job after re-enabling the feature, so not having to wait until the full hour).
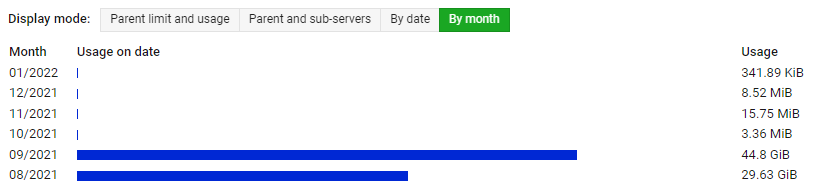
I still have an effect like this (one example virtual host):
Transferred domains added to Virtualmin via restore or import functionality? Are they shown under Servers and log files accordion and Servers to check select? Try selecting servers explicitly.
The servers were transferred from another VirtualMin server using each servers’ “Transfer Virtual Server” function. Most are migrations from CentOS 7 based (current VirtualMin) servers to AlmaLinux8, some were coming from an old CentOS 6 system (also VirtualMin).
They are visible in the servers list for bandwdht monitoring config. I tried switching from “all” to “selected” and selected all servers. Re-running bw.pl didn’t create better bandwidth report/chart. Switched back to “all”.
What I noticed is that VirtualMin doesn’t seem to recognize proftpds’ log file, and the mail log file (although is showing bandwidth for mail?!). On other systems the proftpd logfile /var/log/xferlog is detected, mail not either.
Here’s a screenshot from one of the AlmaLinux 8 servers I’m seeing this problem on:
Replying to myself: unfortunately, selecting every single Virtual Server instead of ticking “All servers” (under “Servers to check”) did not help. The bandwidth monitor for that particular Virtual Server sticks to “0 bytes”.
Hello Jamie, thank you for your reply. The answer to both of your questions is yes.
The Apache log file is /var/log/virtualmin/site.com_access_log (btw easily accessible via Virtualmin > site.com > Logs and Reports > Apache Access Log), the permissions/ownership of the log file look OK and it fills normally.
The format of the logs look exactly the same as the others VS, it is the default one as there are no “LogFormat” directive in the VirtualHost and the “CustomLog” is the default one: CustomLog /var/log/virtualmin/site.com_access_log combined