No it didn’t like it. terminal got stuck and had to break out ^Z
[+1] Stopped Sleep 5 There are Stopped Jobs
Ctrl+C to exit
The command doesn’t output nothing while runs, that’s normal.
Did you checked the log in /var/log/ps.log?

DO you have ps command installed on your system?
Type in terminal:
ps
If not, install it with:
apt-get install procps
procps is already the newest version (2:3.3.16-1ubuntu2.3).
It works on 2 vHosts and my daily driver, just tested and improved it a bit:
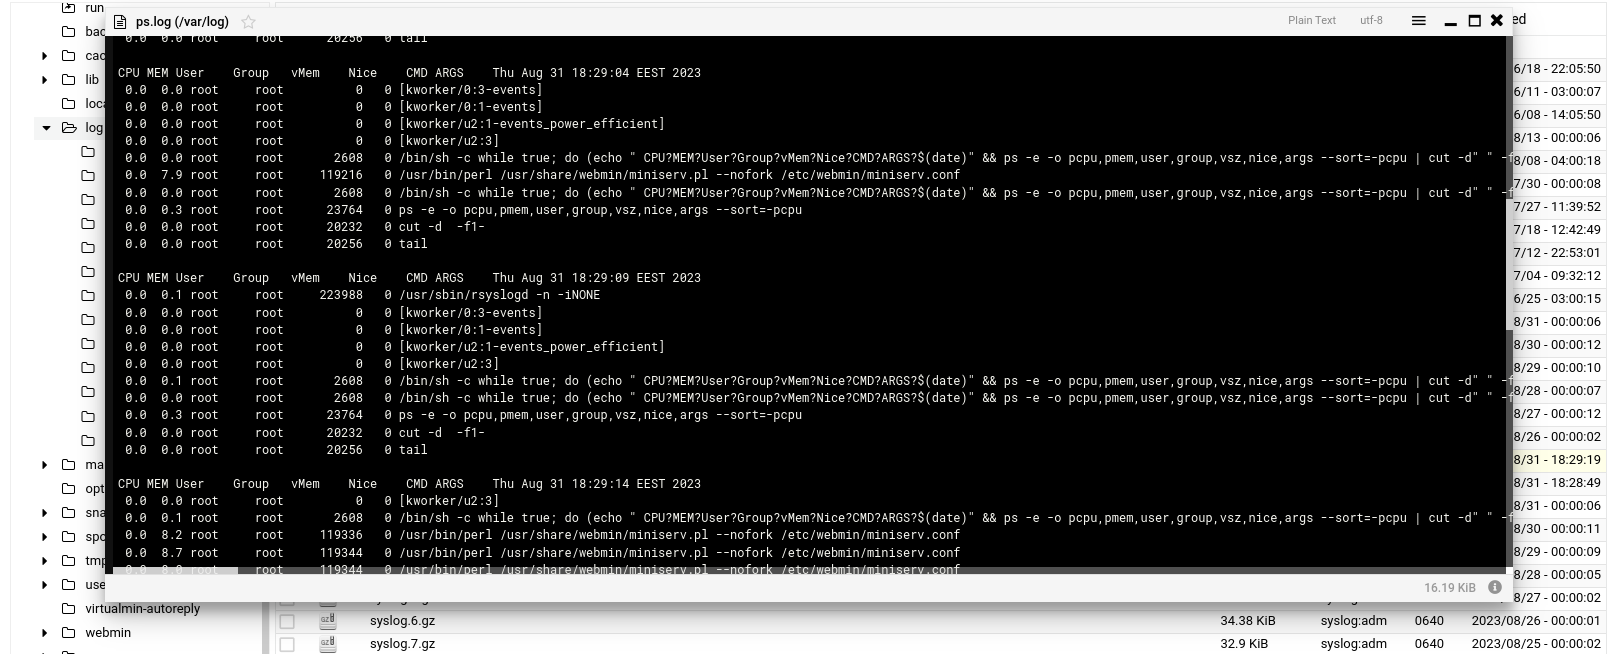
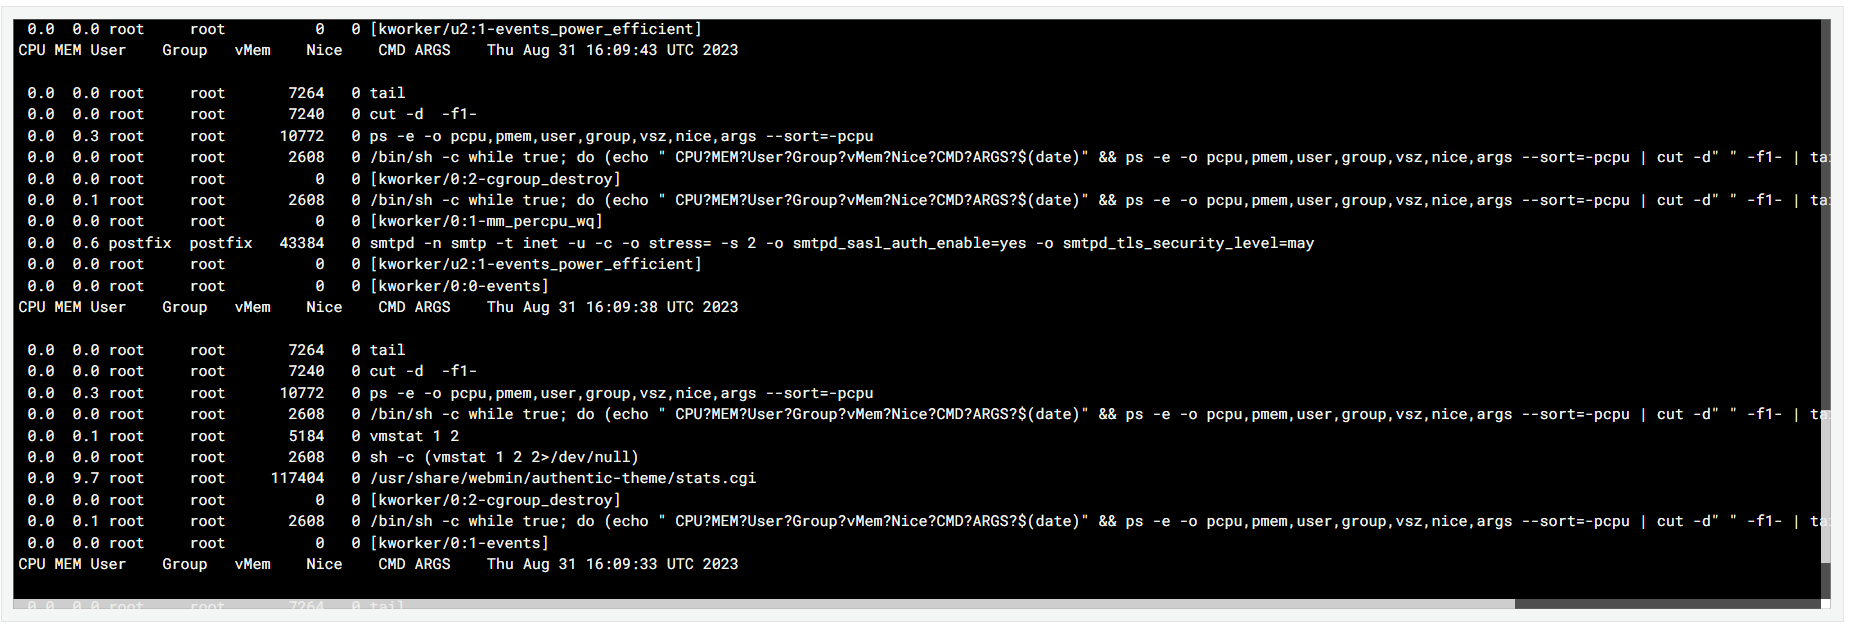
while true; do (echo "\nCPU\tMEM\tUser\tGroup\tvMem\tNice\tCMD\tARGS\t$(date)" && ps -e -o pcpu,pmem,user,group,vsz,nice,args --sort=-pcpu | cut -d" " -f1- | tail) >> /var/log/ps.log; sleep 5; done
And this is the log format for the new version, hope that helps someone:
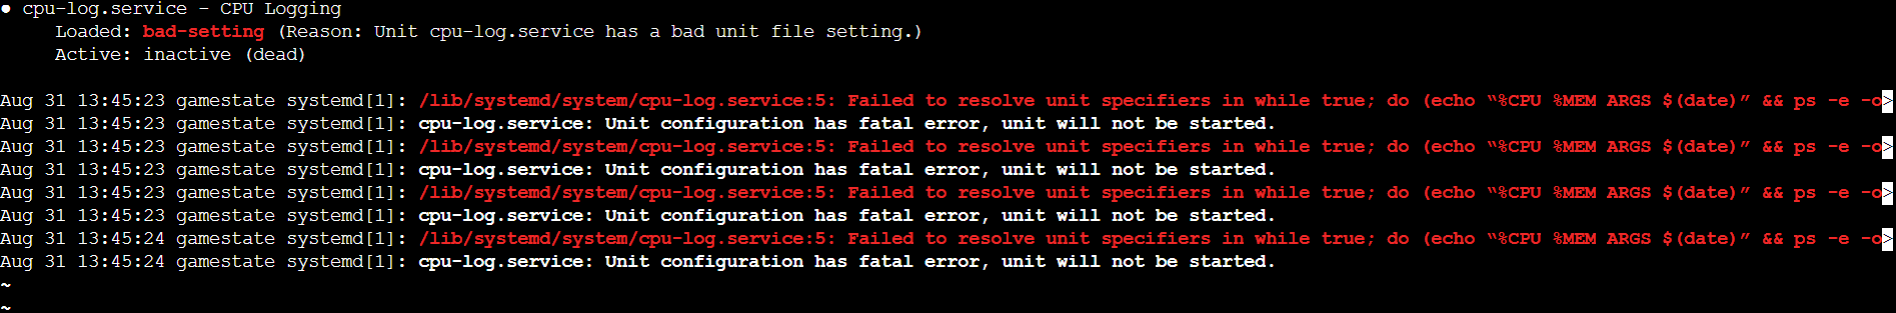
*As a note, if you are in docker or something, maybe ps doesn’t work.
1 Like
That worked !!!
and I have a log to study next time it goes crazy (if it does)
Many thanks for persevering.
You’re welcome, but I also learned something today, so thank you too ![]()
Have you looked at top or htop to see what is using CPU?
1 Like
Yes htop was my first port of call after checking the logs.
But the important thing here is that as I hoped I made clear in the OP this was an event that happened overnight and as of yet has not been repeated. There was nothing in the logs the following morning and everything was back to normal by then. Although I do have concerns about the number of processes they are now at 165 - I do not see any of them that are active other than /usr/share/webmin/proc/index_cpu.cgi which seems to burst into life every now and then. What does that do? It still doesn’t seem to go all the way to 100%.
I wait and hope the new ps.log might capture the ghost process.
Here is an improved script, you can run it manually:
#!/bin/bash
#v. 0.0.0
#cpu minimal limit to log
cpuLimit=50;
#log files
cpuLog="/var/log/cpu-log.log";
cpuLimitLog="/var/log/cpu-limit-log.log";
while true;
###cpuUsage=$(top -bn2 | grep '%Cpu' | tail -1 | grep -P '(....|...) id,'|awk '{print 100-$8}');
cpuUsage=$( cat <(grep 'cpu ' /proc/stat) <(sleep 1 && grep 'cpu ' /proc/stat) | awk -v RS="" '{print ($13-$2+$15-$4)*100/($13-$2+$15-$4+$16-$5)}' );
#comment this next line out if you don't need to log all resource limits
do (echo; echo "CPU usage ${cpuUsage%.*}: $(date)" && ps -e -o pcpu,pmem,user,group,vsz,nice,args --sort=-pcpu | head -10 | cut -d" " -f1- ) >> $cpuLog;
#log if cou utilisation is above a limit
if [ ${cpuUsage%.*} -ge $cpuLimit ]
then
#uncomment next just to see if works
#echo ${cpuUsage%.*};
( echo; echo "CPU usage ${cpuUsage%.*}: $(date)" && ps -e -o pcpu,pmem,user,group,vsz,nice,args --sort=-pcpu | head -10 | cut -d" " -f1- ) >> $cpuLimitLog;
fi;
sleep 5;
done
You can change the cpu limit to log (in your case you want only 100, but I put 50 for testing purposes)
cpuLimit=50;
And now I sorted out to show the processes that really eat up cpu, here is an example of the output (you can change the log file location, I change them to /var/log/cpu-limit-log.log…)
CPU usage 54: Fri Sep  1 06:24:37 EEST 2023
%CPU %MEM USER     GROUP       VSZ  NI COMMAND
21.0  1.9 root     root     123788   0 /usr/share/webmin/authentic-theme/stats.cgi
 5.3 11.4 root     root     1002776  0 /usr/bin/suricata -D --af-packet -c /etc/suricata/suricata.yaml --pidfile /run/suricata.pid
 4.6  0.2 root     root     167756   0 /sbin/init
 1.1  0.7 root     root     1551532  0 /usr/bin/python3 /usr/bin/fail2ban-server -xf start
 0.0  0.0 root     root          0   0 [kthreadd]
 0.0  0.0 root     root          0 -20 [rcu_gp]
 0.0  0.0 root     root          0 -20 [rcu_par_gp]
 0.0  0.0 root     root          0 -20 [slub_flushwq]
 0.0  0.0 root     root          0 -20 [netns]

CPU usage 60: Fri Sep  1 06:25:02 EEST 2023
%CPU %MEM USER     GROUP       VSZ  NI COMMAND
72.0  0.0 root     root       3644   0 gzip -f -9 /var/log/account//pacct.0
 9.6  1.8 root     root     128532   0 /usr/share/webmin/virtual-server/collectinfo.pl
 5.3 11.4 root     root     1002776  0 /usr/bin/suricata -D --af-packet -c /etc/suricata/suricata.yaml --pidfile /run/suricata.pid
 4.6  0.2 root     root     167756   0 /sbin/init
 2.0  1.4 root     root     110656   0 /usr/share/webmin/webmincron/webmincron.pl
 1.1  0.7 root     root     1551532  0 /usr/bin/python3 /usr/bin/fail2ban-server -xf start
 0.0  0.0 root     root          0   0 [kthreadd]
 0.0  0.0 root     root          0 -20 [rcu_gp]
 0.0  0.0 root     root          0 -20 [rcu_par_gp]

CPU usage 50: Fri Sep  1 06:26:30 EEST 2023
%CPU %MEM USER     GROUP       VSZ  NI COMMAND
11.0  0.0 root     root          0   0 [/usr/share/webm] <defunct>
 6.2  1.8 root     root     120216   0 /usr/share/webmin/webmin/refresh_modules.cgi
 5.3 11.4 root     root     1002776  0 /usr/bin/suricata -D --af-packet -c /etc/suricata/suricata.yaml --pidfile /run/suricata.pid
 4.6  0.2 root     root     167756   0 /sbin/init
 1.1  0.7 root     root     1551532  0 /usr/bin/python3 /usr/bin/fail2ban-server -xf start
 0.0  0.0 root     root          0   0 [kthreadd]
 0.0  0.0 root     root          0 -20 [rcu_gp]
 0.0  0.0 root     root          0 -20 [rcu_par_gp]
 0.0  0.0 root     root          0 -20 [slub_flushwq]
Hopefully is more useful than last solution I gave you, for you and for anyone else…
Anyway, sorry for before, was first time coding in bash but that is no excuse.
1 Like